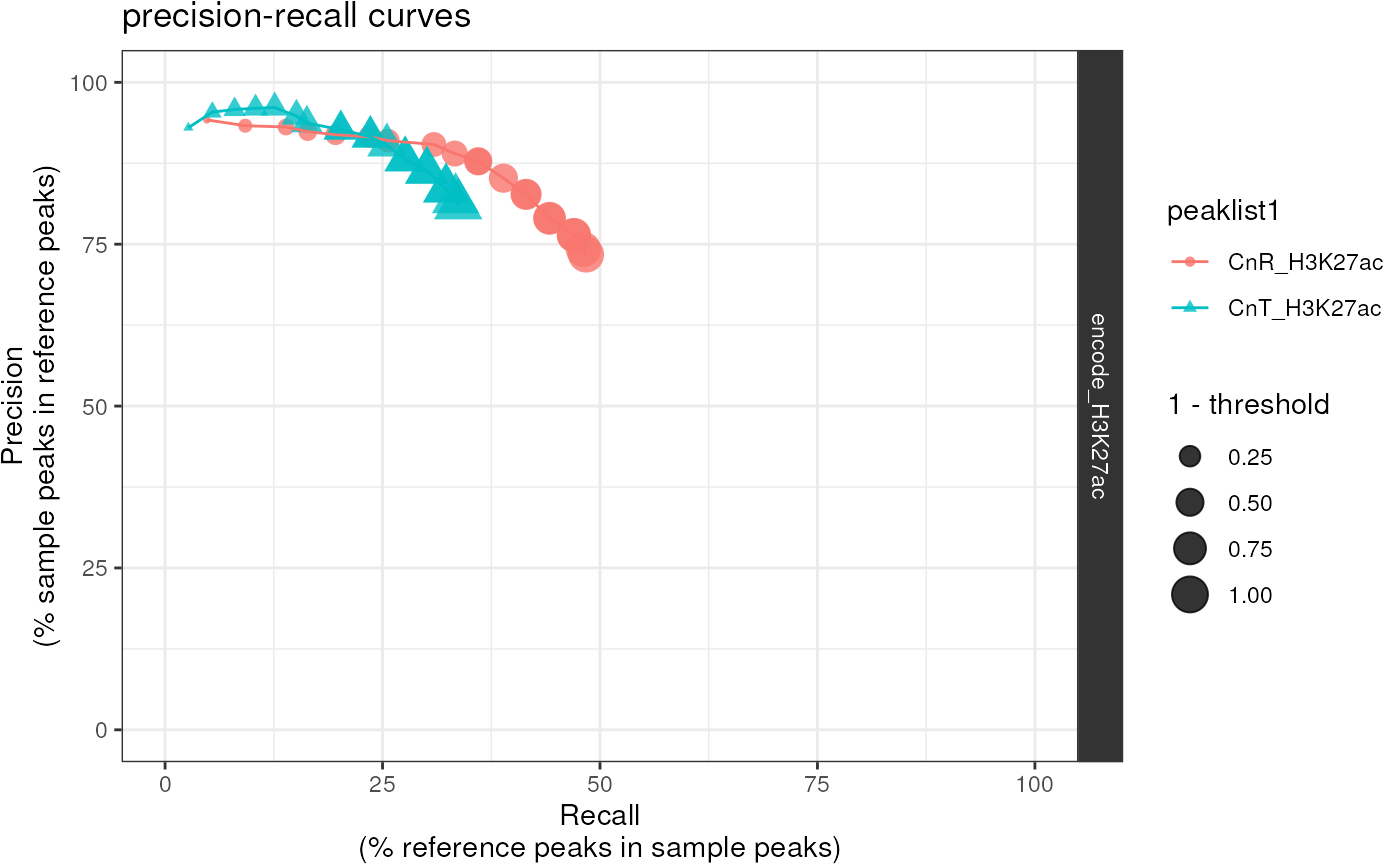
Plot precision-recall curves (and optionally F1 plots) by
iteratively testing for peak overlap across a series of
thresholds used to filter peakfiles.
Each GRanges
object in peakfiles will be used as the "query"
against each GRanges object in reference
as the subject.
Will automatically use any columns that are
specified with thresholding_cols and present within each
GRanges object
to create percentiles for thresholding.
NOTE : Assumes that all GRanges in
peakfiles and reference are already
aligned to the same genome build.
plot_precision_recall(
  peakfiles,
  reference,
  thresholding_cols = c("total_signal", "qValue", "Peak Score"),
  initial_threshold = 0,
  n_threshold = 20,
  max_threshold = 1,
  workers = check_workers(),
  plot_f1 = TRUE,
  subtitle = NULL,
  color = "peaklist1",
  shape = color,
  rows = "peaklist2",
  cols = NULL,
  interact = FALSE,
  show_plot = TRUE,
  save_path = tempfile(fileext = "precision_recall.csv"),
  verbose = TRUE
)
Arguments
- peakfiles
A list of peak files as GRanges object and/or as paths to BED files. If paths are provided, EpiCompare imports the file as GRanges object. EpiCompare also accepts a list containing a mix of GRanges objects and paths.Files must be listed and named using
list(). E.g.list("name1"=file1, "name2"=file2). If no names are specified, default file names will be assigned.- reference
A named list containing reference peak file(s) as GRanges object. Please ensure that the reference file is listed and named i.e.
list("reference_name" = reference_peak). If more than one reference is specified, individual reports for each reference will be generated. However, please note that specifying more than one reference can take awhile. If a reference is specified, it enables two analyses: (1) plot showing statistical significance of overlapping/non-overlapping peaks; and (2) ChromHMM of overlapping/non-overlapping peaks.- thresholding_cols
Depending on which columns are present, GRanges will be filtered at each threshold according to one or more of the following:
"total_signal" : Used by the peak calling software SEACR. NOTE: Another SEACR column (e.g. "max_signal") can be used together or instead of "total_signal".
"qValue"Used by the peak calling software MACS2/3. Should contain the negative log of the p-values after multiple testing correction.
"Peak Score" : Used by the peak calling software HOMER.
- initial_threshold
Numeric threshold that was provided to SEACR (via the parameter
--ctrl) when calling peaks without an IgG control.- n_threshold
Number of thresholds to test.
- max_threshold
Maximum threshold to test.
- workers
Number of threads to parallelize across.
- plot_f1
Generate a plot with the F1 score vs. threshold as well.
- subtitle
Plot subtitle.
- color
Variable to color data points by.
- shape
Variable to set data point shapes by.
- rows, cols
A set of variables or expressions quoted by
vars()and defining faceting groups on the rows or columns dimension. The variables can be named (the names are passed tolabeller).For compatibility with the classic interface,
rowscan also be a formula with the rows (of the tabular display) on the LHS and the columns (of the tabular display) on the RHS; the dot in the formula is used to indicate there should be no faceting on this dimension (either row or column).- interact
Default TRUE. By default, plots are interactive. If set FALSE, all plots in the report will be static.
- show_plot
Show the plot.
- save_path
File path to save precision-recall results to.
- verbose
Print messages.
Value
list with data and precision recall and F1 plots
Examples
data("CnR_H3K27ac")
data("CnT_H3K27ac")
data("encode_H3K27ac")
peakfiles <- list(CnR_H3K27ac=CnR_H3K27ac, CnT_H3K27ac=CnT_H3K27ac)
reference <- list("encode_H3K27ac" = encode_H3K27ac)

pr_out <- plot_precision_recall(peakfiles = peakfiles,
                                reference = reference,
                                workers = 1)
#> Reformatting precision-recall data.
#> Saving precision-recall results ==> /tmp/RtmpYmw2ja/file532a5d01d23aprecision_recall.csv
#> Plotting precision-recall curve.
#> Plotting F1.