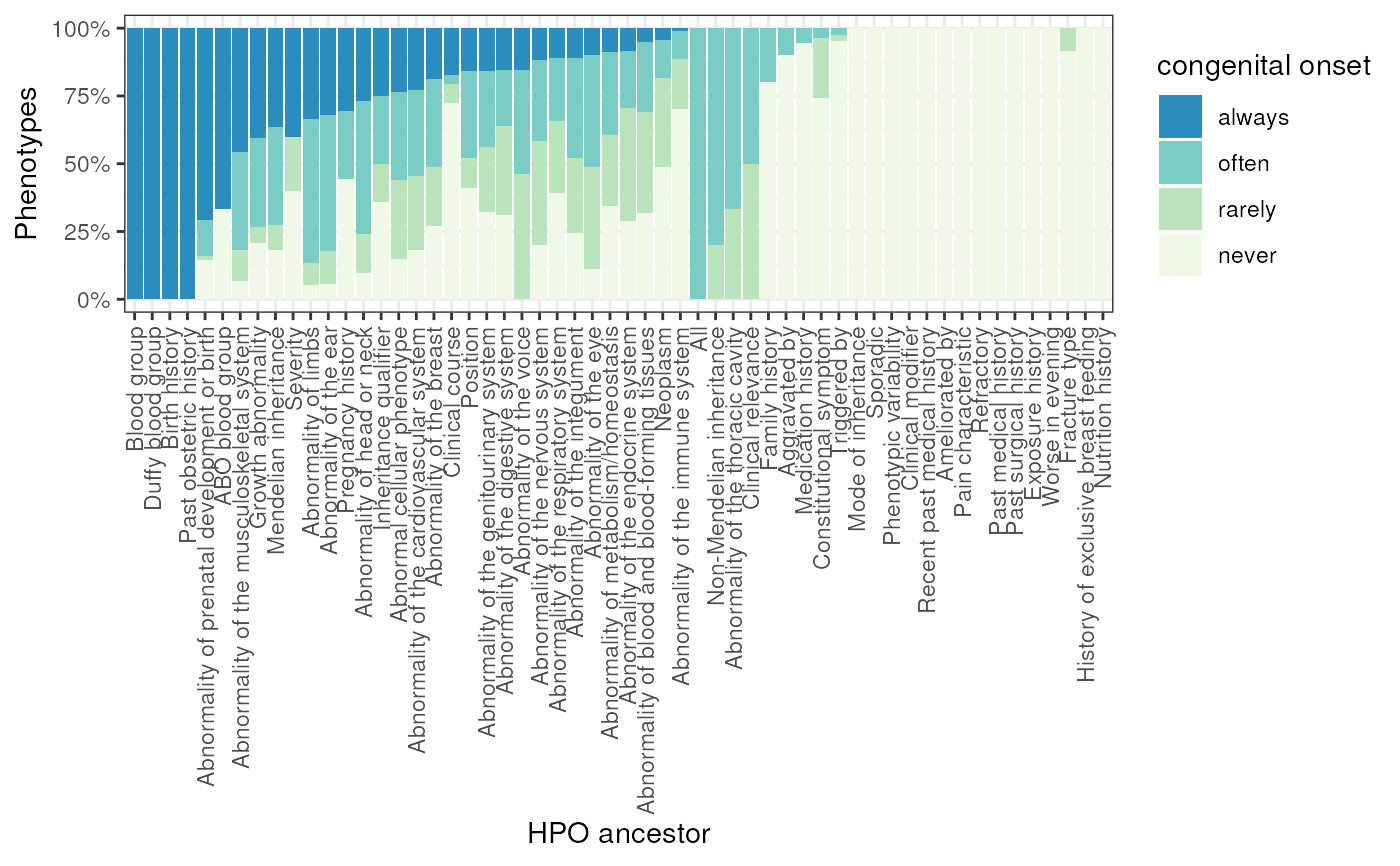
Plot annotations from GPT by ancestral HPO branch.
gpt_annot_plot_branches(
  hpo = get_hpo(),
  gpt_annot = gpt_annot_read(hpo = hpo),
  keep_descendants = NULL,
  keep_ont_levels = NULL,
  metric = "congenital_onset",
  fill_lab = gsub("_", " ", metric),
  show_plot = TRUE
)
Arguments
- hpo
Human Phenotype Ontology object, loaded from get_ontology.
- gpt_annot
Output from gpt_annot_read.
- keep_descendants
Terms whose descendants should be kept (including themselves). Set to
NULL(default) to skip this filtering step.- keep_ont_levels
Only keep phenotypes at certain absolute ontology levels to keep. See add_ont_lvl for details.
- metric
Annotation metric to plot.
- fill_lab
Fill label in legend.
- show_plot
Show the plot.
Value
Named list of plot and data.
Examples
out <- gpt_annot_plot_branches()
#> Translating ontology terms to ids.
#> Reading cached RDS file: phenotype_to_genes.txt
#> + Version: v2025-11-24
#> 151 phenotypes do not have matching HPO IDs.
#> Reading in GPT annotations for 16,982 phenotypes.
#> Adding level-2 ancestor to each HPO ID.
#> Adding ancestor metadata.
#> Ancestor metadata already present. Use force_new=TRUE to overwrite.
#> 17,852 associations remain after filtering.
#> Getting absolute ontology level for 18,082 IDs.