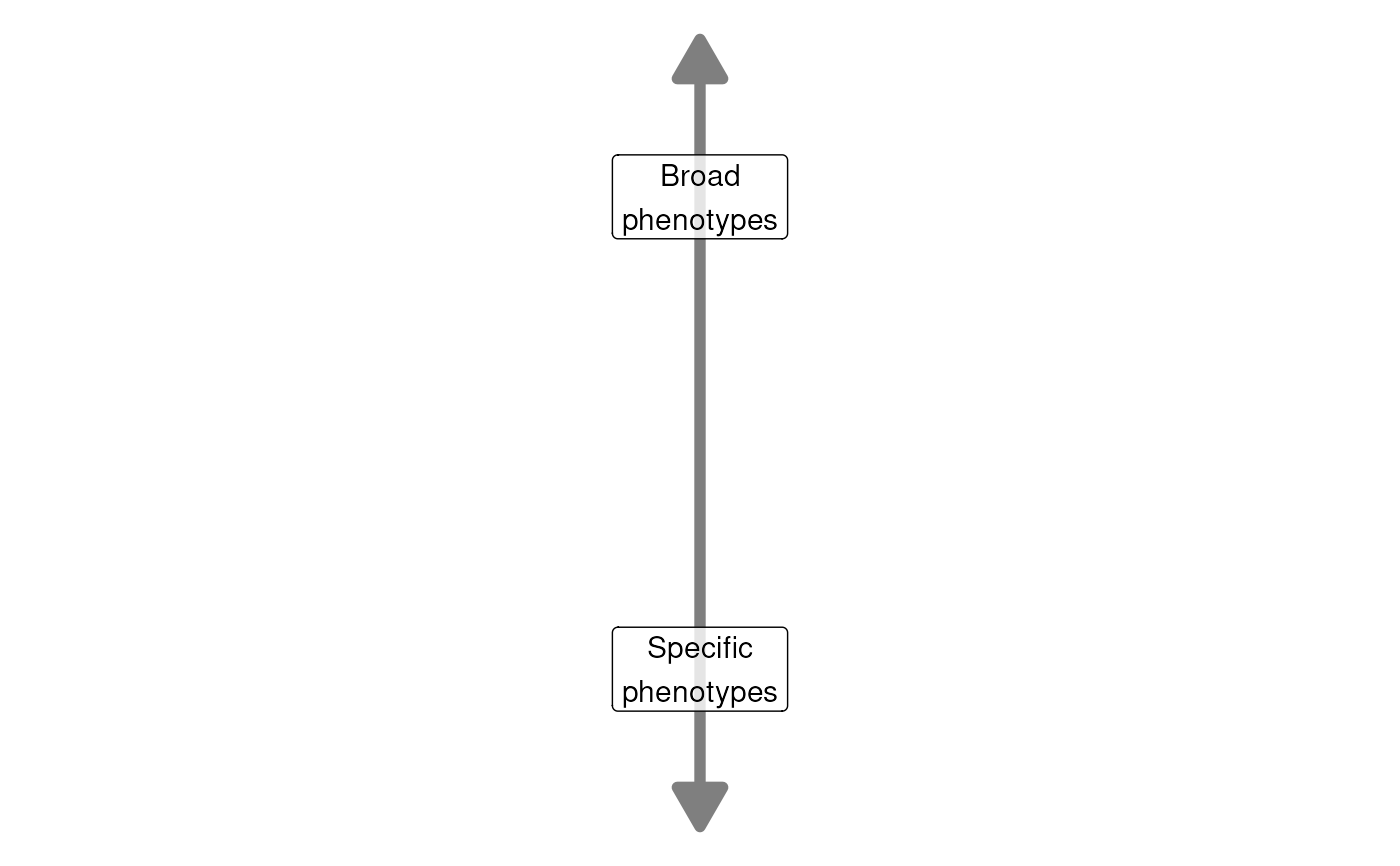
Plot an error indicating the direction of phenotype specificity.
Arguments
- x
x-coordinate of the arrow.
- xend
x-coordinate of the arrow end.
- y
y-coordinate of the arrow.
- yend
y-coordinate of the arrow end.
- labels_x
x-coordinates of the labels.
- labels_y
y-coordinates of the labels.
- labels
Labels for each end of the arrow.
- labels_alpha
Transparency of the labels.
- text_color
Color for the label text.
- labels_size
Size of the labels.
- arrrow_size
Size of the arrow.
- arrow_color
Colour of the arrow.
Value
ggplot2 object.
Examples
plot_arrow()