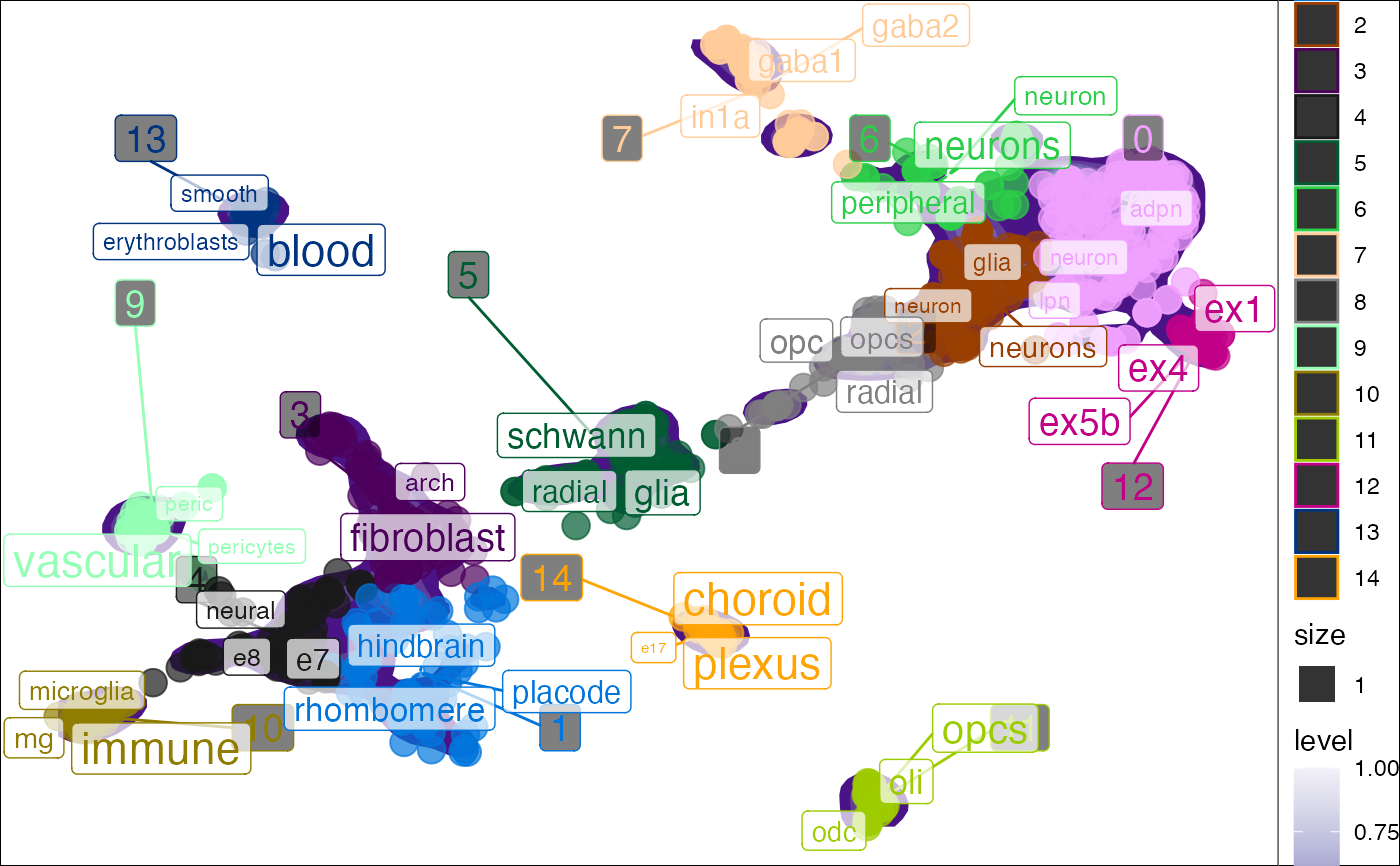
Plot tf-idf enrichment results in reduced dimensional space (e.g. PCA/tSNE/UMAP), Reduced dimensions can be computed based on single-cell data (e.g. RNA expression).
plot_tfidf(
  obj,
  reduction = "UMAP",
  label_var = NULL,
  cluster_var = "seurat_clusters",
  replace_regex = "[.]|[_]|[-]",
  terms_per_cluster = 3,
  size_var = 1,
  color_var = "cluster",
  point_alpha = 0.7,
  point_palette = c(unname(pals::alphabet()), rev(unname(pals::alphabet2()))),
  density_palette = "Purples",
  density_adjust = 0.2,
  label_fill = ggplot2::alpha(c("white"), 0.7),
  show_plot = TRUE,
  background_color = "white",
  text_color = "black",
  force = c(0, 1),
  max.overlaps = c(100, 100),
  legend.position = NULL,
  interact = FALSE,
  force_new = FALSE,
  verbose = TRUE,
  ...
)
Arguments
- obj
Single-cell data object.
- reduction
Name of the reduction to use (case insensitive).
- label_var
Which cell metadata column to input to NLP analysis.
- cluster_var
Which cell metadata column to use to identify which cluster each cell is assigned to.
- replace_regex
Characters used to split
label_varinto terms (i.e. tokens) for NLP enrichment analysis.- terms_per_cluster
The maximum number of words to return per cluster.
- size_var
Point size variable in
objmetadata.- color_var
Point colour variable in
objmetadata.- point_alpha
Point opacity.
- point_palette
Point palette.
- density_palette
Density palette.
- density_adjust
Density adjust (controls granularity of density plot).
- label_fill
Cluster label background colour.
- show_plot
Whether to print the plot.
- background_color
Plot background colour.
- text_color
Cluster label text colour.
- force
Force of repulsion between overlapping text labels. Defaults to 1.
- max.overlaps
Exclude text labels when they overlap too many other things. For each text label, we count how many other text labels or other data points it overlaps, and exclude the text label if it has too many overlaps. Defaults to 10.
- legend.position
the default position of legends ("none", "left", "right", "bottom", "top", "inside")
- interact
Whether to make the plot interactive with plotly.
- force_new
If NLP results are already detected the metadata, set
force_new=TRUEto replace them with new results.- verbose
Whether to print messages.
- ...
Additional arguments to be passed to
ggplot2::geom_point(aes_string(...)).
Value
A list containing:
- obs2
The processed data with TF-IDF results.
- tfidf_df
The full per-cluster TF-IDF enrichment results.
- plot
The ggplot object.
Examples
data("pseudo_seurat")
res <- plot_tfidf(obj = pseudo_seurat,
                  label_var = "celltype",
                  cluster_var = "cluster")
#> Extracting obsm from Seurat: umap
#> + Dropping 2 conflicting obs variables: UMAP.1, UMAP.2
#> Loading required namespace: tidytext
#> Setting cell metadata (obs) in obj.
#> Warning: `aes_string()` was deprecated in ggplot2 3.0.0.
#> ℹ Please use tidy evaluation idioms with `aes()`.
#> ℹ See also `vignette("ggplot2-in-packages")` for more information.
#> ℹ The deprecated feature was likely used in the scNLP package.
#>   Please report the issue at <https://github.com/neurogenomics/scNLP/issues>.
#> Warning: Ignoring unknown aesthetics: label
#> Warning: Using `size` aesthetic for lines was deprecated in ggplot2 3.4.0.
#> ℹ Please use `linewidth` instead.
#> ℹ The deprecated feature was likely used in the scNLP package.
#>   Please report the issue at <https://github.com/neurogenomics/scNLP/issues>.