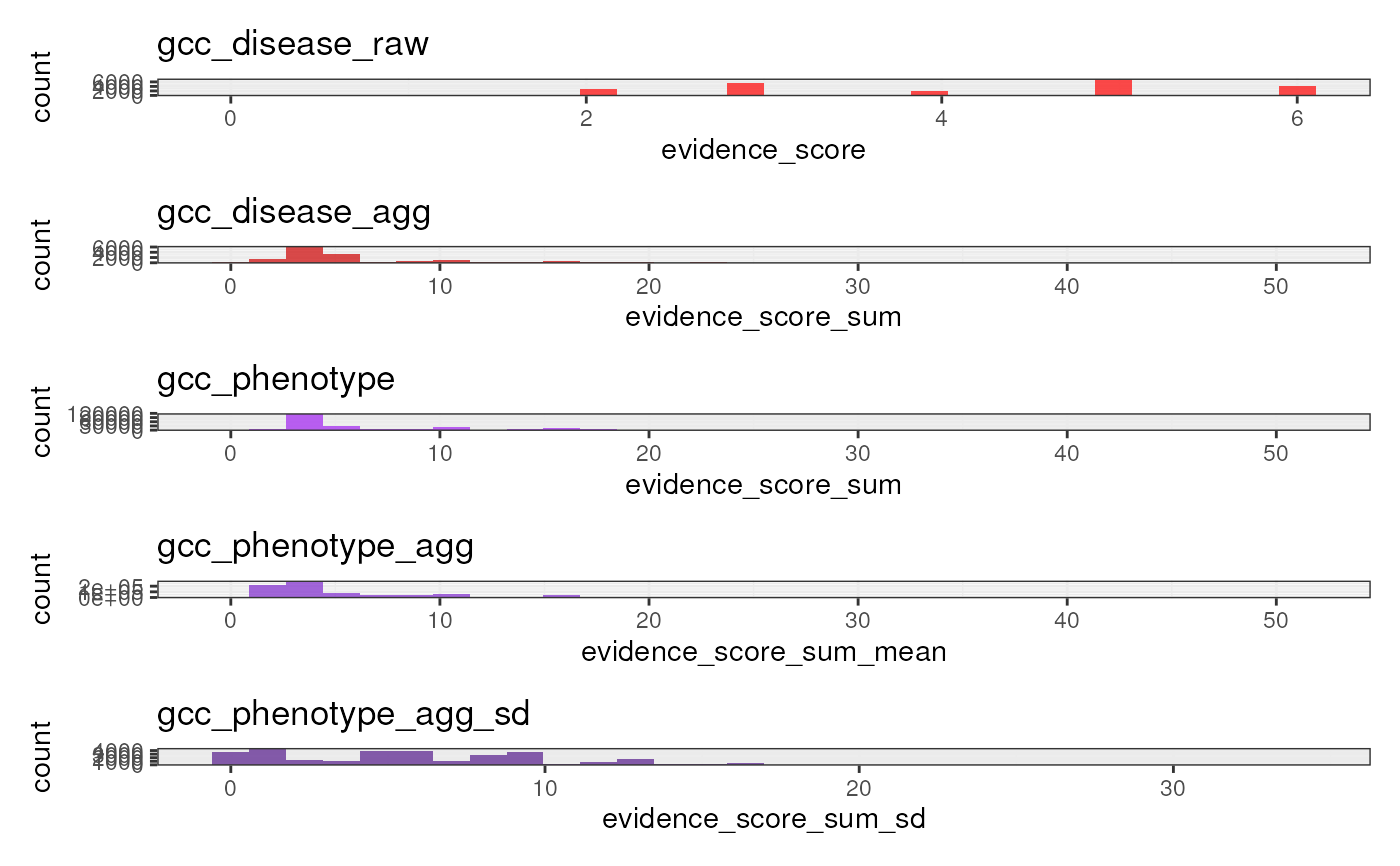
Plot the distribution of evidence scores for gene-disease and gene-phenotype associations.
plot_evidence(
  metric = "evidence_score_sum",
  phenotype_to_genes = load_phenotype_to_genes(),
  show_plot = TRUE,
  save_path = NULL,
  height = NULL,
  width = NULL
)
Arguments
- metric
Aggregated metric of evidence to assess.
- phenotype_to_genes
Output of load_phenotype_to_genes mapping phenotypes to gene annotations.
- show_plot
Show the plot.
- save_path
Path to save interactive plot to as a self-contained HTML file.
- height
Height of the heatmap body.
- width
Width of the heatmap body.
Examples
out <- plot_evidence()
#> Gathering data from GenCC.
#> Importing cached file.
#> Evidence scores for:
#>  - 11050 diseases
#>  - 5533 genes
#> + Version: 2025-12-01
#> Gathering data from GenCC.
#> Importing cached file.
#> Evidence scores for:
#>  - 11050 diseases
#>  - 5533 genes
#> + Version: 2025-12-01
#> Reading cached RDS file: phenotype_to_genes.txt
#> + Version: v2025-11-24
#> Annotating gene-disease associations with Evidence Score
#> Gathering data from GenCC.
#> Importing cached file.
#> Evidence scores for:
#>  - 11050 diseases
#>  - 5533 genes
#> + Version: 2025-12-01
#> Constructing HPO gene x phenotype matrix.
#> Annotating gene-disease associations with Evidence Score
#> Gathering data from GenCC.
#> Importing cached file.
#> Evidence scores for:
#>  - 11050 diseases
#>  - 5533 genes
#> + Version: 2025-12-01
#> `stat_bin()` using `bins = 30`. Pick better value `binwidth`.
#> `stat_bin()` using `bins = 30`. Pick better value `binwidth`.
#> `stat_bin()` using `bins = 30`. Pick better value `binwidth`.
#> `stat_bin()` using `bins = 30`. Pick better value `binwidth`.
#> `stat_bin()` using `bins = 30`. Pick better value `binwidth`.