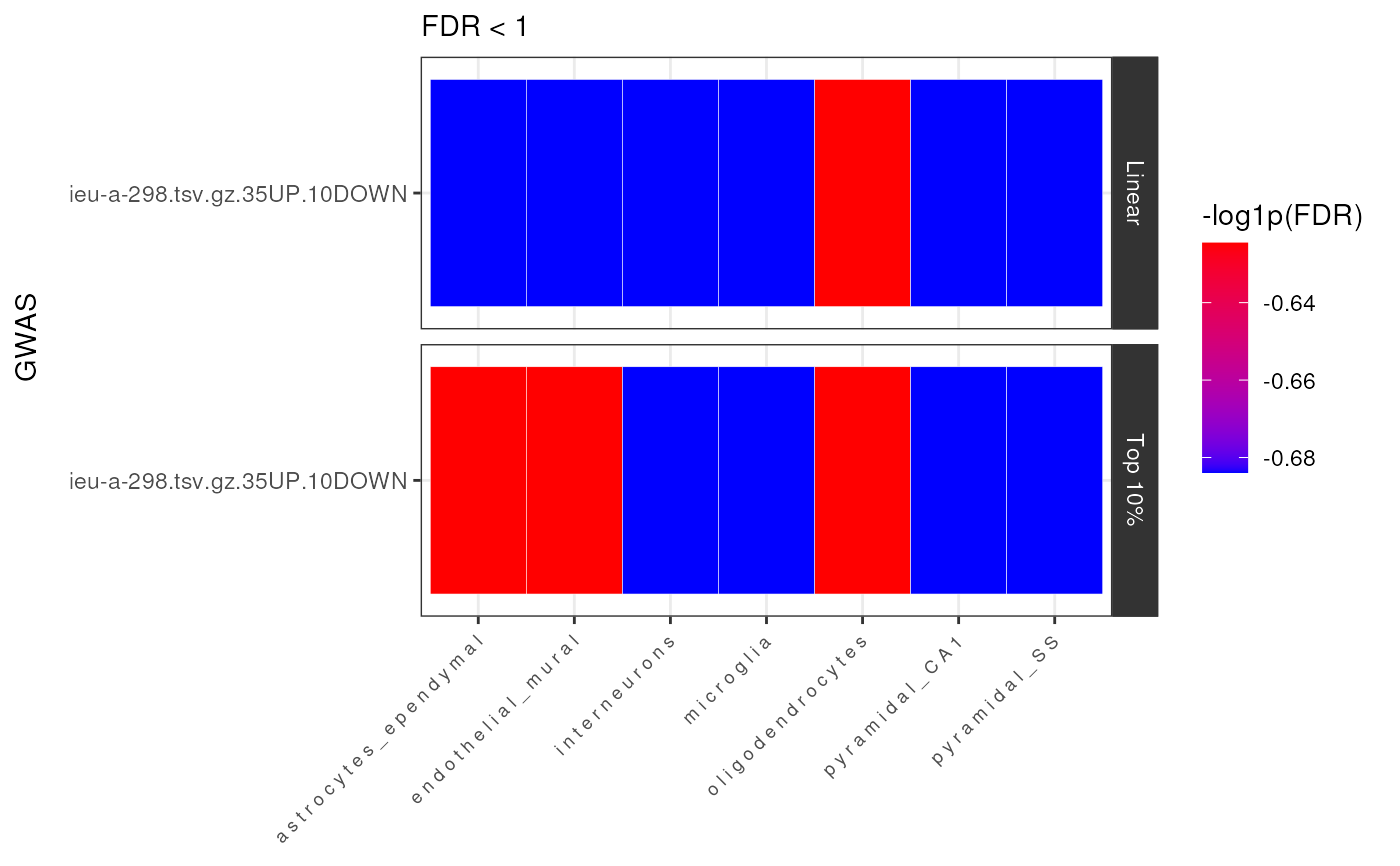
Plot of GWAS x cell-type enrichment results from celltype_associations_pipeline.
Usage
results_heatmap(
  merged_results,
  title = NULL,
  x_lab = NULL,
  fdr_thresh = 0.05,
  facet_formula = NULL,
  facet_rows = "EnrichmentMode",
  facet_cols = NULL,
  x_var = "Celltype",
  y_var = "GWAS",
  fill_var = "-log1p(FDR)",
  scales = "free_y",
  space = "fixed",
  show_plot = TRUE,
  height = 5,
  width = 7,
  dpi = 300,
  save_path = file.path(tempdir(), "MAGMA_Celltyping.heatmap.jpg")
)
Arguments
- merged_results
Enrichment results generated by celltype_associations_pipeline and merged by merge_results.
- title
Plot title.
- x_lab
Plot x-axis label.
- fdr_thresh
FDR filtering threshold.
- facet_formula
Facet formula for plot, passed to facet_grid.
DEPRECATED: Please use
facet_rowsandfacet_colsinstead.- facet_rows
Facet rows for plot, passed to facet_grid.
- facet_cols
Facet columns for plot, passed to facet_grid.
- x_var
x-axis variable.
- y_var
y-axis variable.
- fill_var
Fill variable.
- scales
Are scales shared across all facets (the default,
"fixed"), or do they vary across rows ("free_x"), columns ("free_y"), or both rows and columns ("free")?- space
If
"fixed", the default, all panels have the same size. If"free_y"their height will be proportional to the length of the y scale; if"free_x"their width will be proportional to the length of the x scale; or if"free"both height and width will vary. This setting has no effect unless the appropriate scales also vary.- show_plot
Whether to print the plot.
- height
Plot height.
- width
Plot width.
- dpi
Plot resolution. Also accepts a string input: "retina" (320), "print" (300), or "screen" (72). Only applies when converting pixel units, as is typical for raster output types.
- save_path
Path to save plot to.
Examples
MAGMA_results <- MAGMA.Celltyping::enrichment_results
merged_results <- MAGMA.Celltyping::merge_results(MAGMA_results)
#> Saving full merged results to ==> /tmp/RtmpEkCLL9/MAGMA_celltyping./.lvl1.csv
heat <- MAGMA.Celltyping::results_heatmap(
    merged_results = merged_results,
    fdr_thresh = 1)
#> 14 results @ FDR < 1