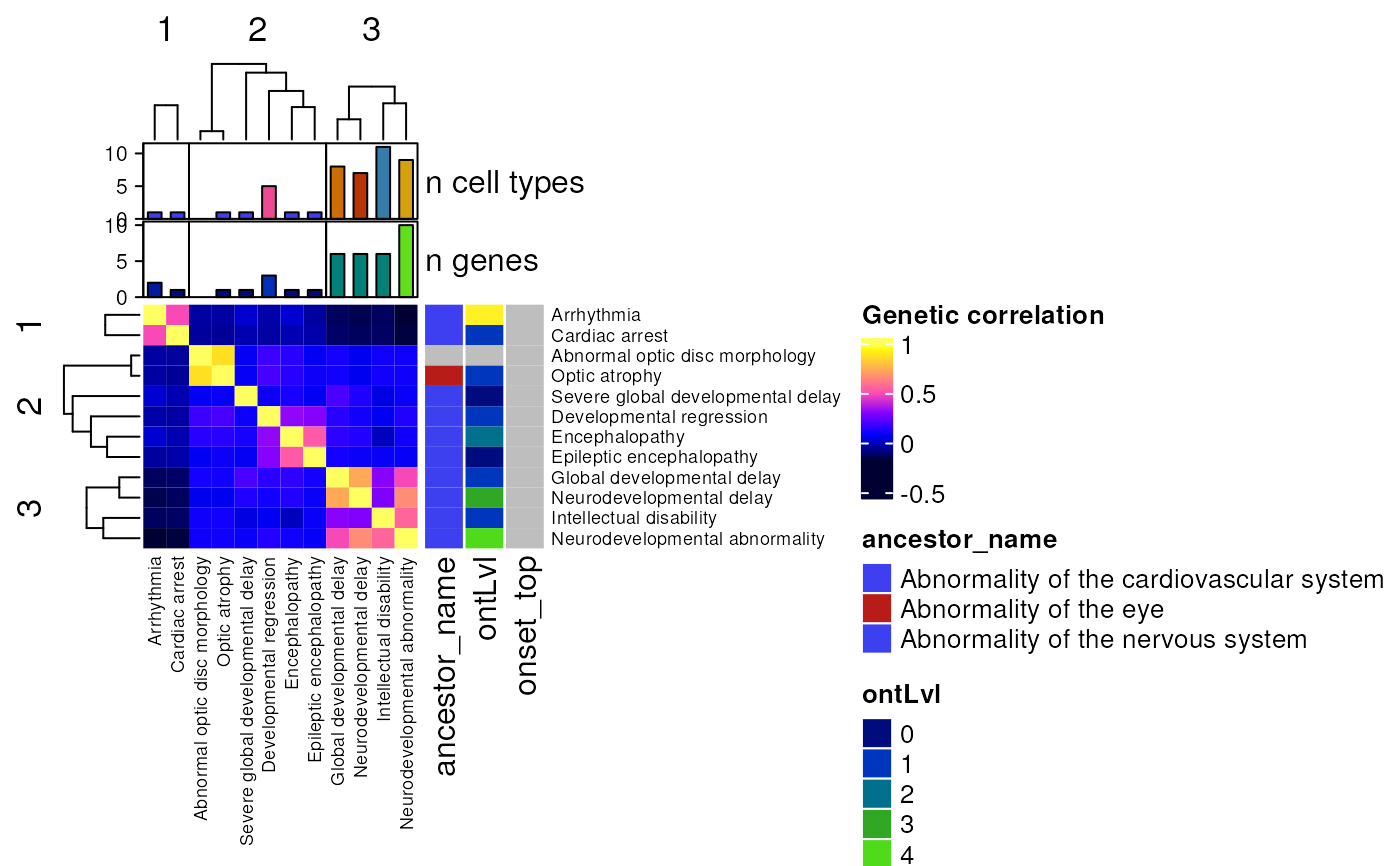
Plot a phenotype x phenotype correlation matrix based on genetic overlap.
correlation_heatmap(
  top_targets,
  row_side_vars = c("ancestor_name", "ontLvl"),
  col_side_vars = c("n_celltypes", "n_genes"),
  row_labels = "hpo_name",
  phenotype_to_genes = HPOExplorer::load_phenotype_to_genes(),
  col = pals::gnuplot(),
  show_plot = TRUE,
  save_path = tempfile(fileext = "correlation_heatmap.pdf"),
  height = 10,
  width = height * 1.3,
  fontsize = 7,
  seed = 2023,
  verbose = TRUE
)
Arguments
- top_targets
data.table of prioritised targets generated by prioritise_targets.
- row_side_vars
Variables to include in row-side metadata annotations.
- col_side_vars
Variables to include in column-side metadata annotations.
- row_labels
Optional row labels which are put as row names in the heatmap.
- phenotype_to_genes
Output of load_phenotype_to_genes mapping phenotypes to gene annotations.
- col
A vector of colors if the color mapping is discrete or a color mapping function if the matrix is continuous numbers (should be generated by
colorRamp2). If the matrix is continuous, the value can also be a vector of colors so that colors can be interpolated. Pass toColorMapping. For more details and examples, please refer to https://jokergoo.github.io/ComplexHeatmap-reference/book/a-single-heatmap.html#colors .- show_plot
Show the plot.
- save_path
Path to save interactive plot to as a self-contained HTML file.
- height
Height of the heatmap body.
- width
Width of the heatmap body.
- fontsize
Axis labels font size.
- seed
Set the seed for reproducible clustering.
- verbose
Print messages.
Value
Plot
Examples
top_targets <- MSTExplorer::example_targets$top_targets[seq(100),]
hm <- correlation_heatmap(top_targets = top_targets)
#> Constructing HPO gene x phenotype matrix.
#> Reading cached RDS file: phenotype_to_genes.txt
#> + Version: v2025-11-24
#> Annotating gene-disease associations with Evidence Score
#> Gathering data from GenCC.
#> Importing cached file.
#> Evidence scores for:
#>  - 11050 diseases
#>  - 5533 genes
#> + Version: 2025-12-01
#> Computing all parwise correlations.
#> Aggregating results by group_var='hpo_name'/'hpo_id'/'ancestor_name'/'ontLvl'
#> Creating heatmap: ComplexHeatmap
#> Using palette: okabe
#> Using palette: tol
#> Using palette: okabe
#> Using palette: tol
#> Saving plot --> /tmp/RtmpVBwwhm/file6aff174816f6correlation_heatmap.pdf