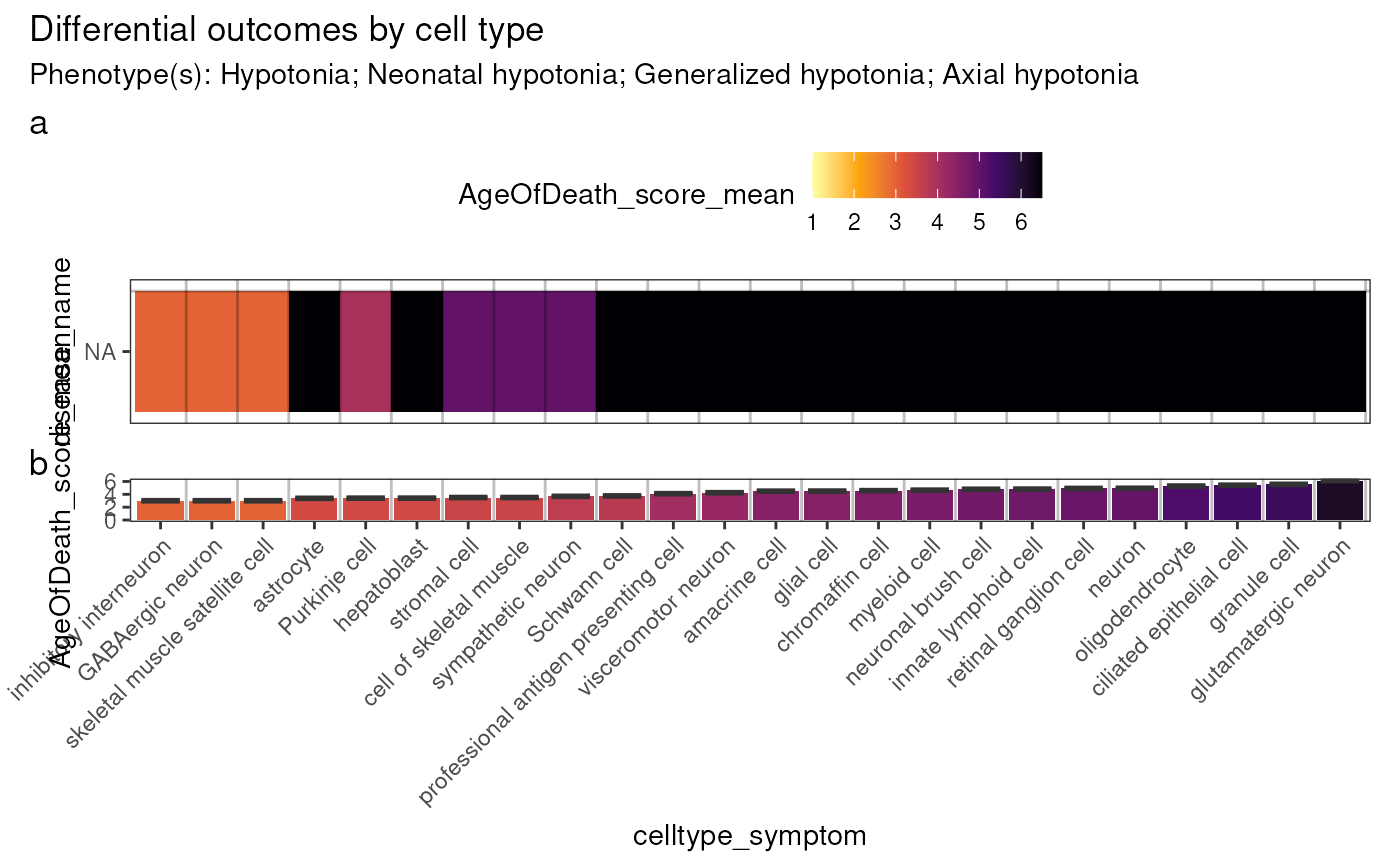
Plot differential outcomes: heatmap
Source:R/plot_differential_outcomes_heatmap.R
plot_differential_outcomes_heatmap.RdPlot differential outcomes: heatmap
plot_differential_outcomes_heatmap(
  phenotypes = NULL,
  results = load_example_results(),
  celltype_col = "cl_name",
  outcome_var = "AgeOfDeath_score_mean",
  x_var = "celltype_symptom",
  title = "Differential outcomes by cell type",
  subtitle = paste0("Phenotype(s): ", paste(phenotypes, collapse = "; ")),
  fill_limits = NULL,
  print_phenotypes = TRUE,
  show_plot = TRUE,
  save_path = NULL,
  height = NULL,
  width = NULL,
  ...
)
Arguments
- phenotypes
HPO phenotypes to include. Can be provided either as names (e.g. "Hypotonia") or HPO IDs (e.g. "HP:0001252").
- results
The cell type-phenotype enrichment results generated by gen_results and merged together with merge_results
- celltype_col
Name of the cell type column in the
results.- outcome_var
Outcome variable to plot.
- x_var
Variable to plot on the x-axis.
- title
Title of the plot.
- subtitle
Subtitle of the plot.
- fill_limits
Min/max limits for the fill scale.
- print_phenotypes
Print the phenotypes in the subtitle.
- show_plot
Print the plot to the console.
- save_path
Save the plot to a file. Set to
NULLto not save the plot.- height
Height of the saved plot.
- width
Width of the saved plot.
- ...
Arguments passed on to
add_symptom_resultsannotLevelsThe annotation level to use within each CTD in
ctd_list.keep_quantilesQuantiles to keep in each CellTypeDataset of the
ctd_list.proportion_driver_genes_symptom_thresholdThe minimum proportion of overlap between symptom genes (genes annotated to a phenotype via a specific disease) and the driver genes (genes driving a signficant phenotype-cell type association).
drop_subthresholdDrop rows that don't meet the
proportion_driver_genes_symptom_thresholdcriterion.top_nTop N genes to keep when grouping by
group_vars.ctd_listA named list of CellTypeDataset objects each created with generate_celltype_data.
q_thresholdThe q value threshold to subset the
resultsby.effect_thresholdThe minimum fold change in specific expression to subset the
resultsby.phenotype_to_genesOutput of load_phenotype_to_genes mapping phenotypes to gene annotations.
Examples
results <- load_example_results()
keep_descendants <- "Hypotonia" # HP:0001252
results2 <- HPOExplorer::filter_descendants(results,
                                            keep_descendants = keep_descendants)
#> Translating ontology terms to ids.
#> Keeping descendants of 1 term(s).
#> 14 terms remain after filtering.
#> 2,814 associations remain after filtering.
results2 <- HPOExplorer::add_death(results2,
                                  allow.cartesian = TRUE,
                                  agg_by = c("disease_id","hpo_id"))
#> Annotating phenos with AgeOfDeath.
#> Reading cached RDS file: phenotype_to_genes.txt
#> + Version: v2025-11-24
#> Adding genes and disease IDs.
out <- plot_differential_outcomes_heatmap(results=results2)
#> Adding symptom-level results.
#> Reading cached RDS file: phenotype_to_genes.txt
#> + Version: v2025-11-24
#> Subsetting results by q_threshold and effect.
#> 76,018 associations remain after filtering.
#> Mapping cell types to cell ontology terms.
#> Adding stage information.
#> Warning: Both 'merge_cols' and '..merge_cols' exist in calling scope. Please remove the '..merge_cols' variable in calling scope for clarity.
#> Reading cached RDS file: phenotype_to_genes.txt
#> + Version: v2025-11-24
#> Loading ctd_DescartesHuman.rds
#> Loading ctd_HumanCellLandscape.rds