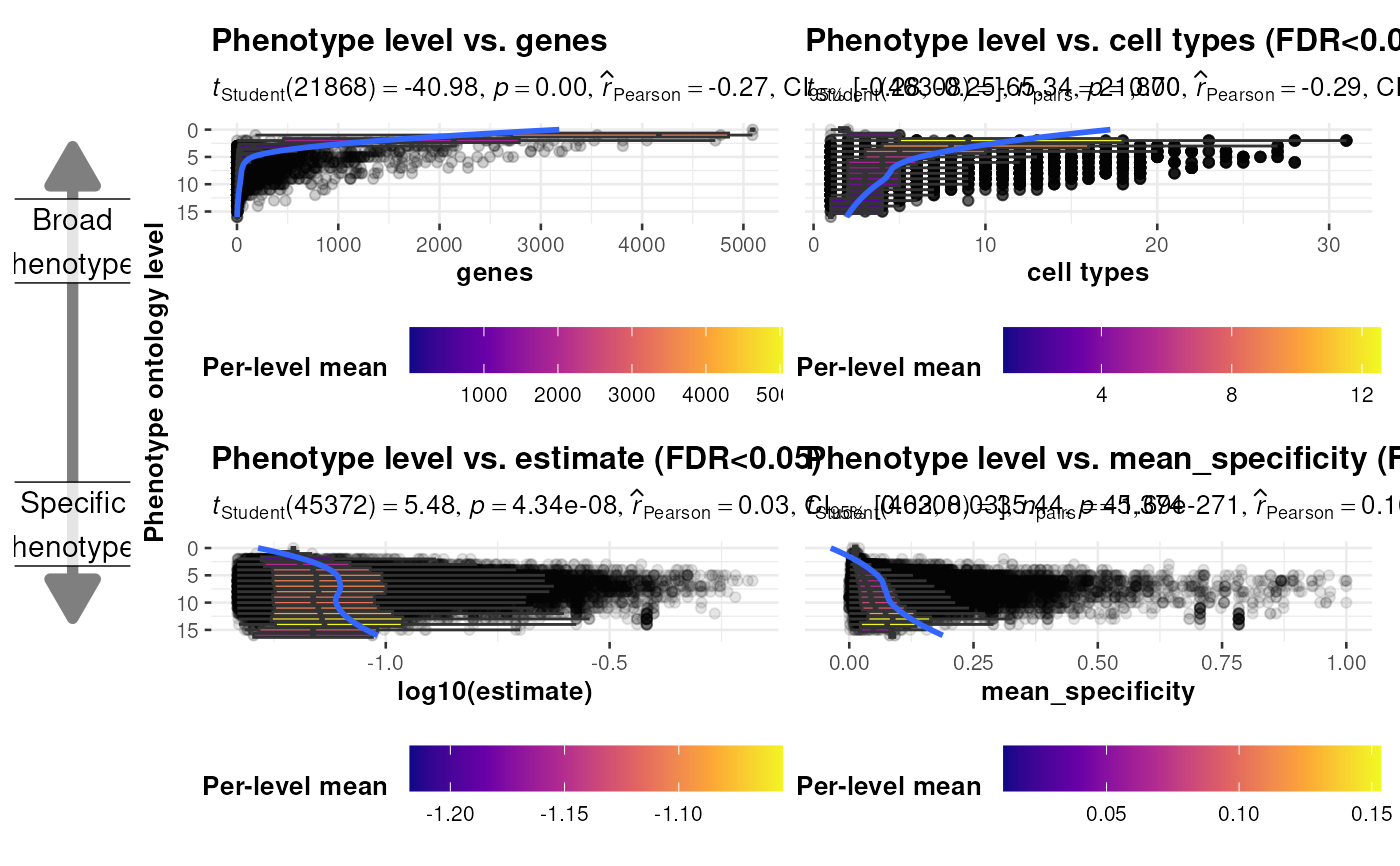
Generate plots comparing the ontology level of each HPO phenotype and several other metrics.
plot_ontology_levels(
  results = load_example_results(),
  p2g = HPOExplorer::load_phenotype_to_genes(),
  ctd_list = load_example_ctd(file = paste0("ctd_", unique(results$ctd), ".rds"),
    multi_dataset = TRUE),
  x_vars = c("genes", "cell types", "estimate", "mean_specificity"),
  y_vars = rep("info_content_binned", length(x_vars)),
  log_vars = x_vars %in% c("estimate", "statistic", "F", "ges", "p", "effect"),
  sig_vars = x_vars %in% c("estimate", "statistic", "F", "ges", "p", "effect",
    "cell types", "mean_specificity"),
  neg_vars = c("log2(p)", "log2(FDR)"),
  group_vars = c("hpo_id", unique(y_vars), "ctd"),
  geom = "ggscatterstats",
  type = "parametric",
  stats_idx = NULL,
  q_threshold = 0.05,
  min_value = NULL,
  label.x.npc = 0.05,
  label.y.npc = 0.5,
  n.breaks = 4,
  notch = FALSE,
  nrow = 2,
  add_arrow = TRUE,
  show_plot = TRUE,
  save_path = NULL,
  height = 7,
  width = length(x_vars) * 5.75,
  smooth.line.args = list(method = "lm", se = FALSE),
  return_data = TRUE,
  rasterize_points = TRUE,
  dpi = 100
)
Arguments
- results
The cell type-phenotype enrichment results generated by gen_results and merged together with merge_results
- p2g
Phenotype to gene data.
- ctd_list
A named list of CellTypeDataset objects each created with generate_celltype_data.
- x_vars
Variables to plot on the x-axis of each subplot.
- y_vars
Variables to plot on the y-axis of each subplot.
- log_vars
Logical vector indicating which variables to log-transform.
- sig_vars
Logical vector indicating which variables to only plot for significant results.
- neg_vars
Names of variables to make negative if they are detected in the post-processed data.
- group_vars
Compute the mean value for each
x_varsgrouped by thegroup_vars. This can be less accurate for some metrics but helps to drastically reduce computational load.- geom
The geometric object to use to display the data for this layer. When using a
stat_*()function to construct a layer, thegeomargument can be used to override the default coupling between stats and geoms. Thegeomargument accepts the following:A
Geomggproto subclass, for exampleGeomPoint.A string naming the geom. To give the geom as a string, strip the function name of the
geom_prefix. For example, to usegeom_point(), give the geom as"point".For more information and other ways to specify the geom, see the layer geom documentation.
- type
A character specifying the type of statistical approach:
"parametric""nonparametric""robust""bayes"
You can specify just the initial letter.
- stats_idx
Indices of statistics to keep in subtitle
- q_threshold
The q value threshold to subset the
resultsby.- min_value
Minimum value for the
specificitymetric.- label.x.npc, label.y.npc
can be
numericorcharactervector of the same length as the number of groups and/or panels. If too short they will be recycled.If
numeric, value should be between 0 and 1. Coordinates to be used for positioning the label, expressed in "normalized parent coordinates".If
character, allowed values include: i) one of c('right', 'left', 'center', 'centre', 'middle') for x-axis; ii) and one of c( 'bottom', 'top', 'center', 'centre', 'middle') for y-axis.
If too short they will be recycled.
- n.breaks
Passed to scale_fill_viridis_c.
- notch
If
FALSE(default) make a standard box plot. IfTRUE, make a notched box plot. Notches are used to compare groups; if the notches of two boxes do not overlap, this suggests that the medians are significantly different.- nrow
Number of facet rows for the plot.
- add_arrow
Add arrows indicating whether phenotypes are more broader or more specific across ontology levels.
- show_plot
Print the plot to the console.
- save_path
Save the plot to a file. Set to
NULLto not save the plot.- height
Height of the saved plot.
- width
Width of the saved plot.
- smooth.line.args
A list of additional aesthetic arguments to be passed to
geom_smoothgeom used to display the regression line.- return_data
Return the full long data used in the plots.
- rasterize_points
Whether to rasterize the points in the scatter plots.
- dpi
Resolution of image after rasterization.
Value
A named list containing the data and the plot.
Examples
out <- plot_ontology_levels()
#> Loading required namespace: gginnards
#> Loading required namespace: ggrastr
#> Adding information_content scores.
#> Reading cached RDS file: phenotype_to_genes.txt
#> + Version: v2025-11-24
#> Adding genes and disease IDs.
#> Loading ctd_DescartesHuman.rds
#> Loading ctd_HumanCellLandscape.rds
#> Warning: no non-missing arguments to max; returning -Inf
#> Warning: no non-missing arguments to min; returning Inf
#> Reading cached RDS file: phenotype_to_genes.txt
#> + Version: v2025-11-24
#> Filtering q-values < 0.05 : 'cell types'
#> Filtering q-values < 0.05 : 'estimate'
#> log2 transforming x-axis: 'estimate'
#> Warning: NaNs produced
#> Filtering q-values < 0.05 : 'mean_specificity'
#> `geom_smooth()` using formula = 'y ~ x'
#> `geom_smooth()` using formula = 'y ~ x'
#> `geom_smooth()` using formula = 'y ~ x'