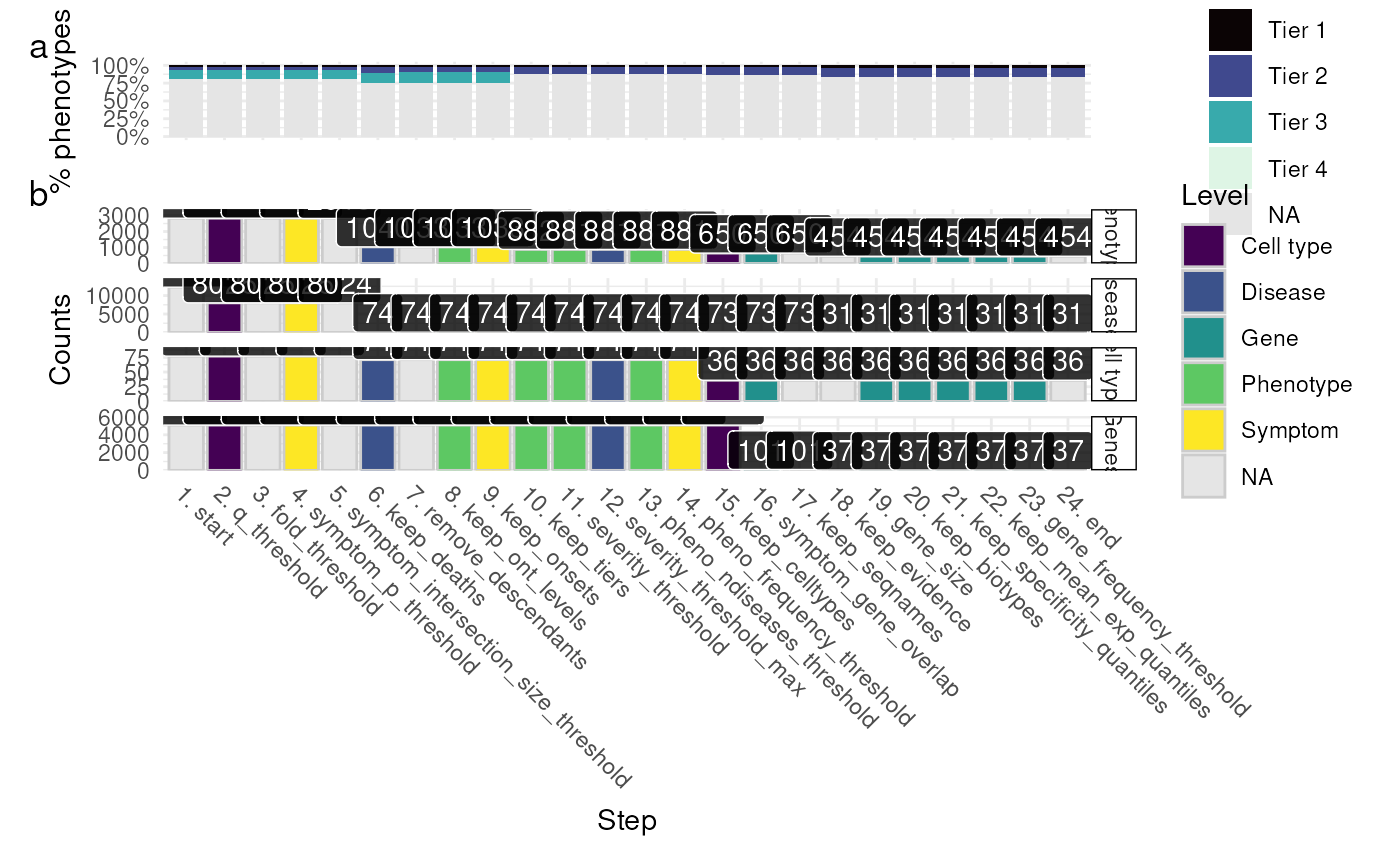
Plot the results of a filtering report generated by prioritise_targets.
plot_report(
  rep_dt,
  results,
  phenotype_to_genes = HPOExplorer::load_phenotype_to_genes(1),
  annot = HPOExplorer::load_phenotype_to_genes(3),
  remove_cols = c("Rows", "Rows_diff", "ids"),
  label.size = 0.25,
  show_plot = TRUE,
  add_tiers = TRUE,
  save_path = tempfile(fileext = "_plot_report.pdf"),
  verbose = TRUE,
  ...
)
Arguments
- rep_dt
Report table.
- results
The cell type-phenotype enrichment results generated by gen_results and merged together with merge_results
- phenotype_to_genes
Phenotype to gene mapping from load_phenotype_to_genes.
- annot
HPO annotations.
- remove_cols
Columns to remove from
rep_dt.- label.size
![[Deprecated]](figures/lifecycle-deprecated.svg) Replaced by the
Replaced by the
linewidthaesthetic. Size of label border, in mm.- show_plot
Print the plot to the console.
- add_tiers
Add severity tiers subplot.
- save_path
Save the plot to a file. Set to
NULLto not save the plot.- verbose
Print messages.
- ...
Arguments passed on to
ggplot2::ggsavefilenameFile name to create on disk.
plotPlot to save, defaults to last plot displayed.
deviceDevice to use. Can either be a device function (e.g. png), or one of "eps", "ps", "tex" (pictex), "pdf", "jpeg", "tiff", "png", "bmp", "svg" or "wmf" (windows only). If
NULL(default), the device is guessed based on thefilenameextension.pathPath of the directory to save plot to:
pathandfilenameare combined to create the fully qualified file name. Defaults to the working directory.scaleMultiplicative scaling factor.
width,heightPlot size in units expressed by the
unitsargument. If not supplied, uses the size of the current graphics device.unitsOne of the following units in which the
widthandheightarguments are expressed:"in","cm","mm"or"px".dpiPlot resolution. Also accepts a string input: "retina" (320), "print" (300), or "screen" (72). Only applies when converting pixel units, as is typical for raster output types.
limitsizeWhen
TRUE(the default),ggsave()will not save images larger than 50x50 inches, to prevent the common error of specifying dimensions in pixels.bgBackground colour. If
NULL, uses theplot.backgroundfill value from the plot theme.create.dirWhether to create new directories if a non-existing directory is specified in the
filenameorpath(TRUE) or return an error (FALSE, default). IfFALSEand run in an interactive session, a prompt will appear asking to create a new directory when necessary.
Value
ggplot object
Examples
results <- load_example_results()
rep_dt <- example_targets$report
gp <- plot_report(rep_dt=rep_dt, results=results)
#> plot_report:: Preparing data.
#> Reading cached RDS file: phenotype.hpoa
#> + Version: v2025-11-24
#> Reading cached RDS file: phenotype_to_genes.txt
#> + Version: v2025-11-24
#> plot_report:: Preparing plot.

#> Saving plot ==> /tmp/RtmpVBwwhm/file6aff6f0af1ed_plot_report.pdf
#> Saving 6.67 x 6.67 in image
#> Saving plot ==> /tmp/RtmpVBwwhm/file6aff6f0af1ed_plot_report.pdf
#> Saving 6.67 x 6.67 in image