Predict the causal cell types underlying a patient's phenotypes given some varying degree of prior knowledge.
predict_celltypes(
  phenotypes,
  diseases_include = NULL,
  diseases_exclude = NULL,
  genes_include = NULL,
  genes_exclude = NULL,
  gene_weights = list(include = 2, default = 1, exclude = 0),
  results = MSTExplorer::load_example_results(),
  phenotype_to_genes = HPOExplorer::load_phenotype_to_genes(),
  agg_var = c("cl_name"),
  effect_var = "logFC",
  x_var = agg_var[1],
  y_var = "score_mean",
  fill_var = "score_sum",
  evidence_score_var = "evidence_score_sum",
  max_x_var = 10,
  subtitle_size = 9,
  plot.margin = ggplot2::margin(1, 1, 1, 40),
  show_plot = TRUE,
  save_path = NULL,
  width = NULL,
  height = NULL
)
Arguments
- phenotypes
Phenotypes observed in the patient. Can be a list of HPO phenotype IDs or HPO phenotype names.
- diseases_include
Diseases that the patient is known to have. Can be provided as OMIM, Orphanet, or DECIPHER disease IDs.
- diseases_exclude
Diseases that the patient is known NOT to have. Can be provided as OMIM, Orphanet, or DECIPHER disease IDs.
- genes_include
Genes in which the patient is known to have abnormalities.
- genes_exclude
Genes in which the patient is known NOT to have abnormalities.
- gene_weights
A named list describing the weight to apply to genes in the include, default, and exclude lists.
- results
The cell type-phenotype enrichment results generated by gen_results and merged together with merge_results
- phenotype_to_genes
Phenotype to gene mapping from load_phenotype_to_genes.
- agg_var
The variable(s) to aggregate
resultsby.- effect_var
Name of the effect size column in the
results.- x_var
Variable to plot on the x-axis.
- y_var
Variable to plot on the y-axis.
- fill_var
Variable to fill by.
- evidence_score_var
Which variable from add_evidence to use when weighting genes.
- max_x_var
The maximum number of cell types to display.
- subtitle_size
Size of the plot subtitle.
- plot.margin
margin around entire plot (
unitwith the sizes of the top, right, bottom, and left margins); inherits frommargin.- show_plot
Print the plot to the console.
- save_path
Save the plot to a file. Set to
NULLto not save the plot.- width
Width of the saved plot.
- height
Height of the saved plot.
Value
data.table of prioritised cell types, sorted by a "score" that combines:
The phenotype-cell type enrichment p-values ("p").
The phenotype-cell type enrichment effect size ("effect").
A gene-wise factor that upweights/downweights included/excluded genes respectively, multiplied by the evidence score of a phenotype-gene association. Only applied when
genes_includeorgenes_excludeis provided.
Examples
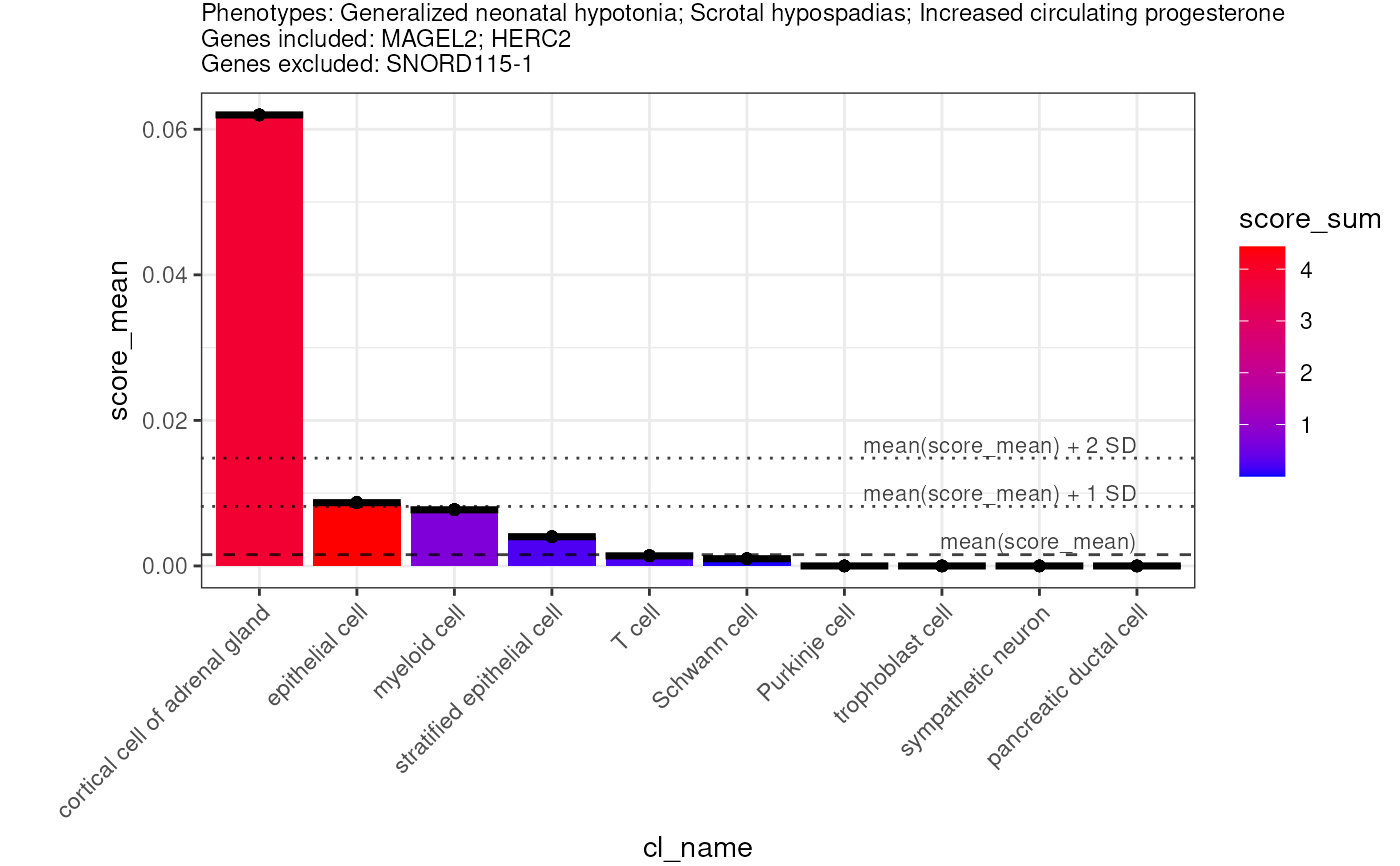
phenotypes <- c("Generalized neonatal hypotonia",
                "Scrotal hypospadias",
                "Increased circulating progesterone")
# diseases_include <- "OMIM:176270"
genes_include <- c("MAGEL2","HERC2")
genes_exclude <- c("SNORD115-1")
ct <- predict_celltypes(phenotypes = phenotypes,
                        genes_include = genes_include,
                        genes_exclude = genes_exclude)
#> Translating ontology terms to ids.
#> Adding logFC column.
#> Reading cached RDS file: phenotype_to_genes.txt
#> + Version: v2025-11-24
#> Adding genes and disease IDs.
#> Mapping cell types to cell ontology terms.
#> Adding stage information.
#> Reading cached RDS file: phenotype_to_genes.txt
#> + Version: v2025-11-24
#> Loading ctd_DescartesHuman.rds
#> Loading ctd_HumanCellLandscape.rds
#> Annotating gene-disease associations with Evidence Score
#> Gathering data from GenCC.
#> Importing cached file.
#> Evidence scores for:
#>  - 11050 diseases
#>  - 5533 genes
#> + Version: 2025-12-01
#> Warning: no non-missing arguments to min; returning Inf
#> Warning: no non-missing arguments to max; returning -Inf
#> Warning: A shallow copy of this data.table was taken so that := can add or remove 1 columns by reference. At an earlier point, this data.table was copied by R (or was created manually using structure() or similar). Avoid names<- and attr<- which in R currently (and oddly) may copy the whole data.table. Use set* syntax instead to avoid copying: ?set, ?setnames and ?setattr. It's also not unusual for data.table-agnostic packages to produce tables affected by this issue. If this message doesn't help, please report your use case to the data.table issue tracker so the root cause can be fixed or this message improved.
#> Warning: no non-missing arguments to max; returning -Inf
#> Warning: no non-missing arguments to max; returning -Inf
#> Warning: no non-missing arguments to max; returning -Inf
#> Warning: Removed 1 row containing missing values or values outside the scale range
#> (`geom_hline()`).
#> Warning: Removed 1 row containing missing values or values outside the scale range
#> (`geom_hline()`).
#> Warning: Removed 1 row containing missing values or values outside the scale range
#> (`geom_hline()`).