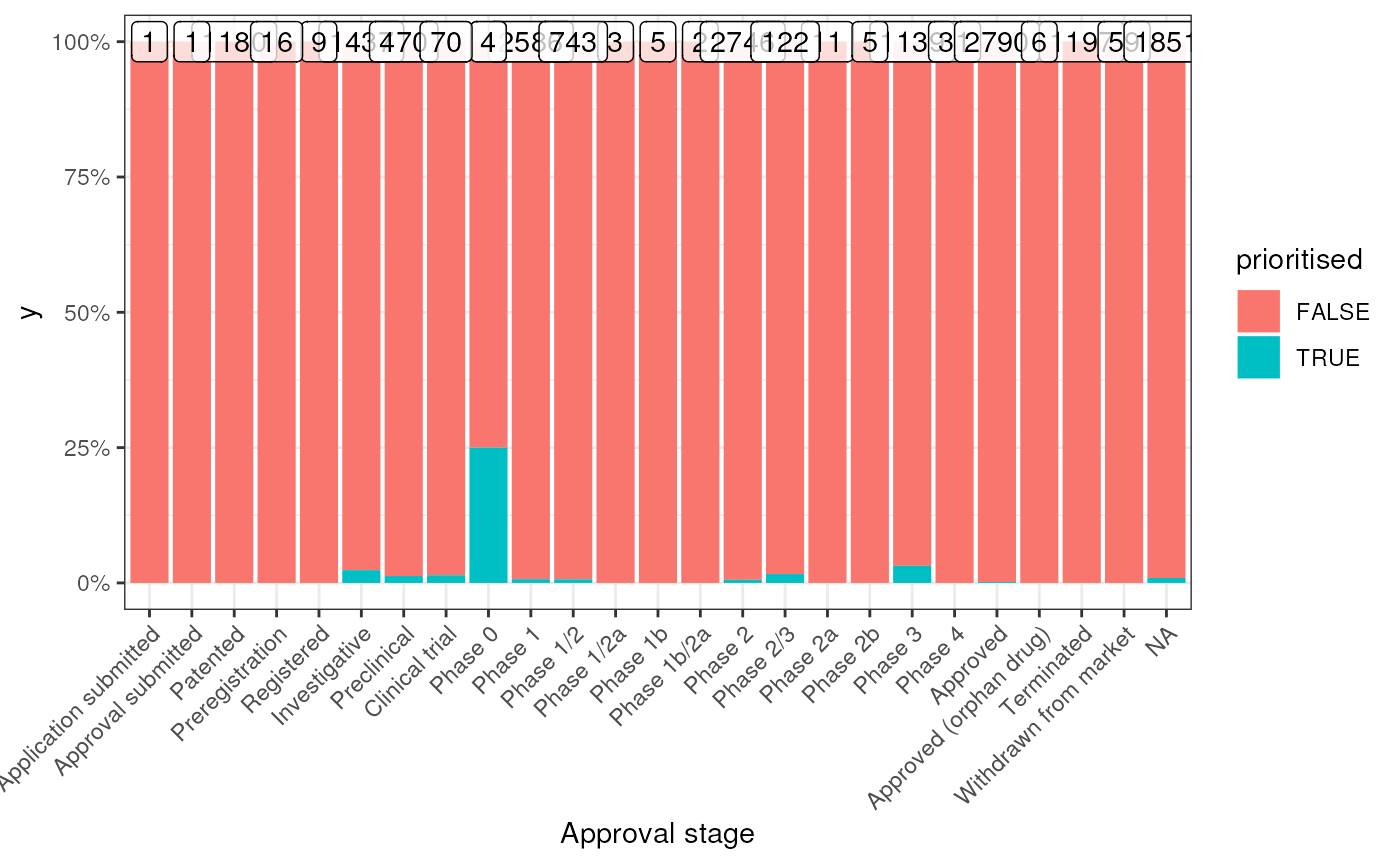
Identify the overlap between your prioritised list of gene therapy targets and currently existing gene therapy targets that are currently on the market or are in clinical trials. Uses data from the Therapeutic Target Database.
ttd_check(
  top_targets,
  drug_types = NULL,
  failed_status = c("Terminated", "Withdrawn from market", "Discontinued*", NA),
  keep_status = NULL,
  remove_status = c(NA),
  allow.cartesian = FALSE,
  run_map_genes = FALSE,
  add_descriptions = FALSE,
  force_new = FALSE,
  as_percent = TRUE,
  base_size = 9,
  label_size = 2,
  show_plot = TRUE,
  save_path = NULL,
  height = NULL,
  width = NULL,
  phenotype_to_genes = HPOExplorer::load_phenotype_to_genes()
)
Arguments
- top_targets
Top targets generated by prioritise_targets.
- drug_types
Filter results by drug type.
- failed_status
Drug approval status categories that indicate the drug failed.
- keep_status
Filter results by drug approval status.
- remove_status
Remove results by drug approval status.
- allow.cartesian
See
allow.cartesianin[.data.table.- run_map_genes
Map genes to standardised HGNC symbols using map_genes.
- add_descriptions
Add disease names and descriptions.
- force_new
If TRUE, force a new download.
- as_percent
Show the plot's y-axis as a percentage within each x-axis group (TRUE). Otherwise, show y-axis as the number of drugs within that x-axis group.
- base_size
Base size for ggplot2 theme.
- label_size
Size of labels in plot.
- show_plot
Print the plot to the console.
- save_path
Save the plot to a file. Set to
NULLto not save the plot.- height
Height of the saved plot.
- width
Width of the saved plot.
- phenotype_to_genes
Phenotype to gene mapping from load_phenotype_to_genes.
Examples
 if(.Platform$OS.type!="windows") {
top_targets <- MSTExplorer::example_targets$top_targets
res <- ttd_check(top_targets=top_targets,
                 run_map_genes=FALSE)
 }
#> Loading required namespace: readxl
#> Reading cached RDS file: phenotype_to_genes.txt
#> + Version: v2025-11-24