Get Started
Authors: Salman Fawad, Yunning Yuan, Alan Murphy, Nathan
Skene
Authors: Salman Fawad, Yunning Yuan, Alan Murphy, Nathan Skene
Vignette updated: Apr-02-2025
Source: Vignette updated: Apr-02-2025
vignettes/getting_started.Rmd
getting_started.RmdThe poweranalysis R package is designed to run robust power analysis for differential gene expression in scRNA-seq studies and provides tools to estimate the optimal number of samples and cells needed to achieve reliable power levels.
Differential Gene Expression (DGE) Analysis
Import an SCE object and perform differential expression analysis
using a pseudobulking approach, enabling the robust identification of
differentially expressed genes (DEGs) across conditions or groups from
single-cell data.
To run the DGE analysis, first load your own
SingleCellExperiment (SCE) object.
# Load your SCE object (replace with actual file path)
library(qs)

SCE <- qs::qread("./data/sce.qs")
To use the DGE_analysis function, specify the formula
for comparison along with the pseudobulk ID and celltype ID. The
function requires the following key arguments:
· design: A formula that defines the
variables included in the model for differential expression analysis.
This determines how gene expression is compared across different
groups.
· coef: A character string that
specifies which group in the design formula you want to
investigate for differential expression.
Example Usage:
To validate the differential
expression (DEG) analysis approach, you can run a comparison between
sexes using the design = ~ sex. This will assess how gene
expression differs between male and female groups.
# Run the DGE_analysis function for a sex comparison
DGE_analysis.sex <- DGE_analysis(
  SCE,
  design = ~ sex,
  coef = "M",
  celltypeID="cluster_celltype",
  sampleID = "sample_id",
)
If you want to compare disease and control conditions, specify the disease status in the formula and the disease group of interest in the coef.
# Run the DGE_analysis function for a disease vs. control comparison
DGE_analysis.AD <- DGE_analysis(
  SCE,
  design = ~ pathological_diagnosis,
  coef = "AD",
  sampleID = "sample_id",
  celltypeID = "cluster_celltype"
)
Power Analysis
Assess the accuracy of DEG detection in scRNA-seq data by
systematically down-sampling the dataset at varying numbers of
individuals and cells. DEGs identified in each subset are compared to
those from the full dataset to compute the percentage of True Positive
(PTP) DEGs recovered and the False Discovery Rate (FDR).
To perform power analysis based on sex-specific DEGs, use the following function:
# Run the power_analysis function for a sex comparison
power_analysis.sex <- power_analysis(
  SCE,
  design = ~ sex,
  coef = "M",
  sampleID = "sample_id",
  celltypeID = "cluster_celltype")
The power_analysis function generates several key
outputs:
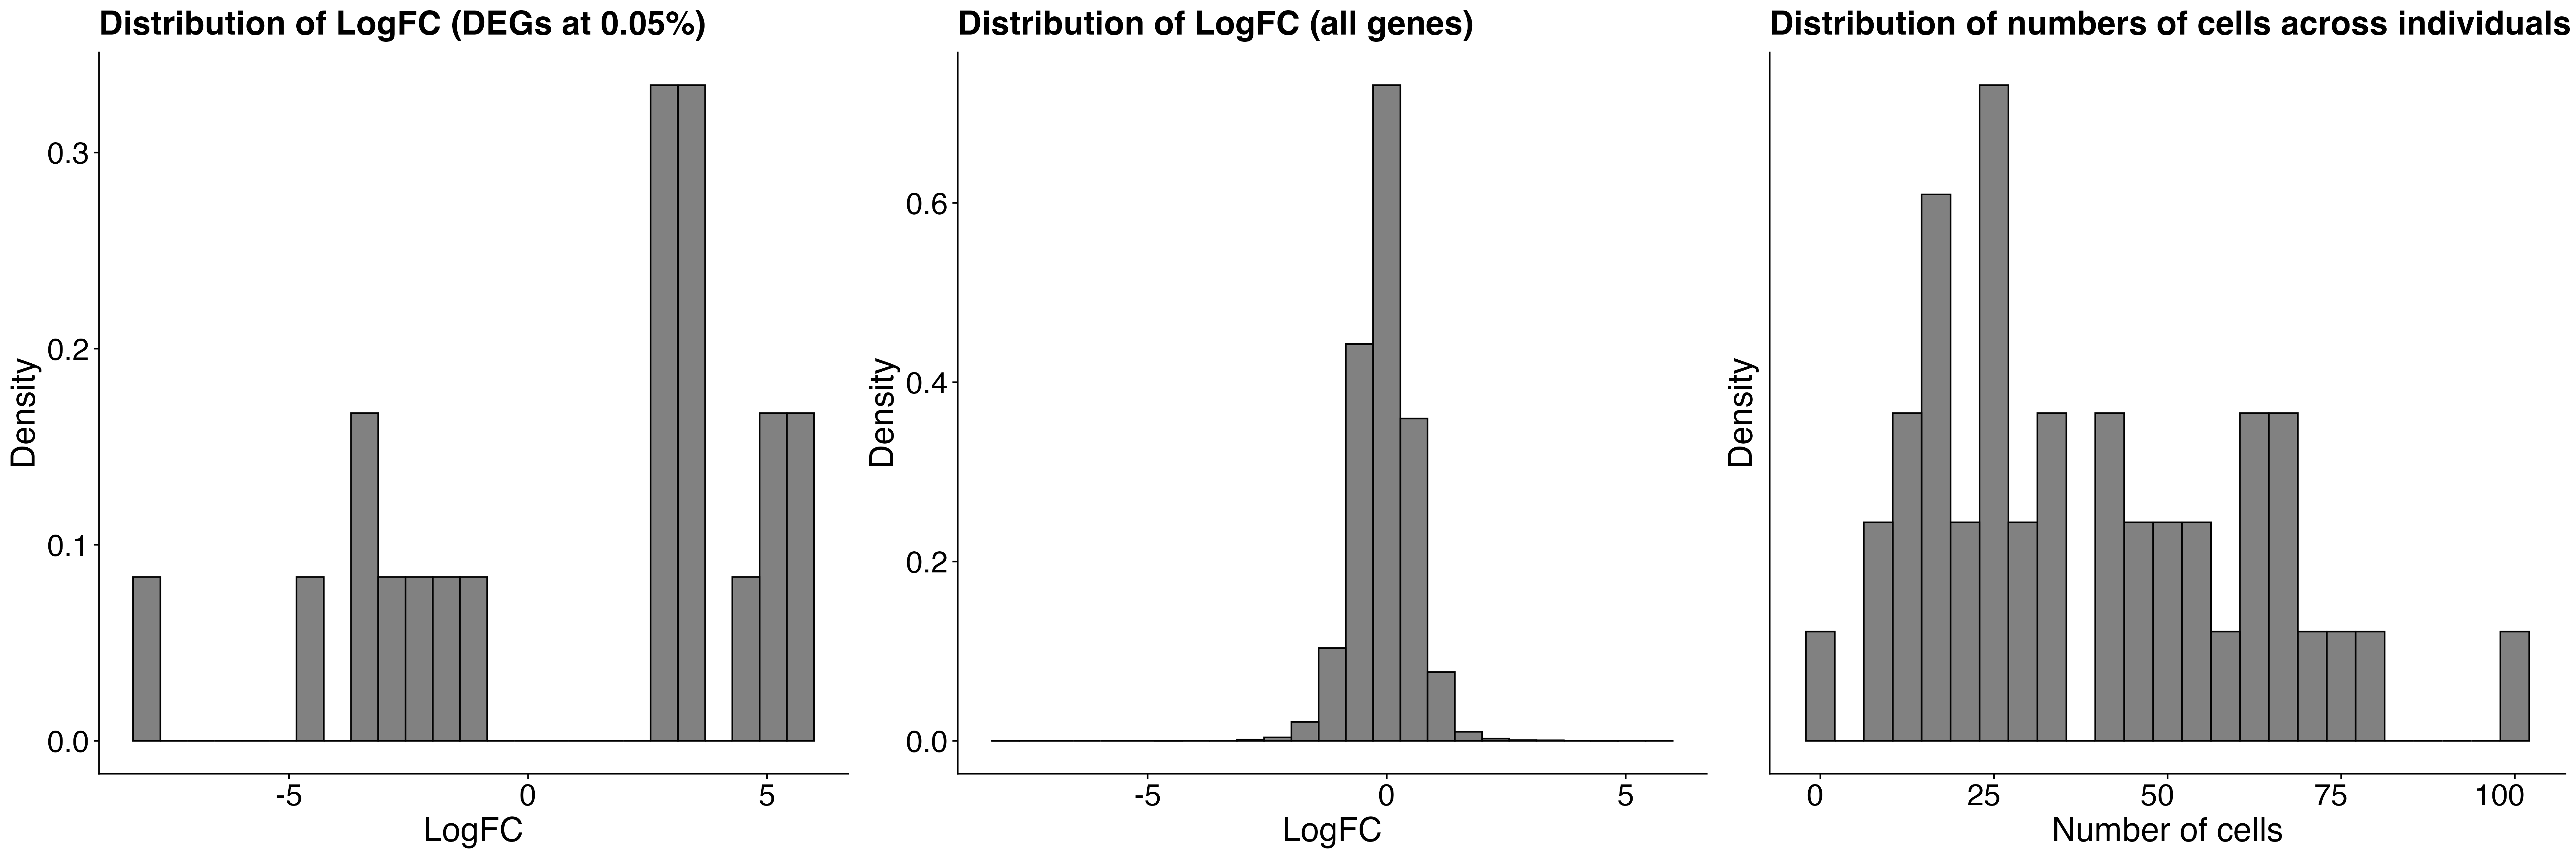
-
QC plots display distributions of effect sizes
(log2 fold-change) across detected DEGs and the number of cells per
individual in the full dataset.
- DGE analysis results identify PTP DEGs and non-DEGs using a 0.05 cut-off for both nominal and adjusted p-values over the down-sampling range of datasets.
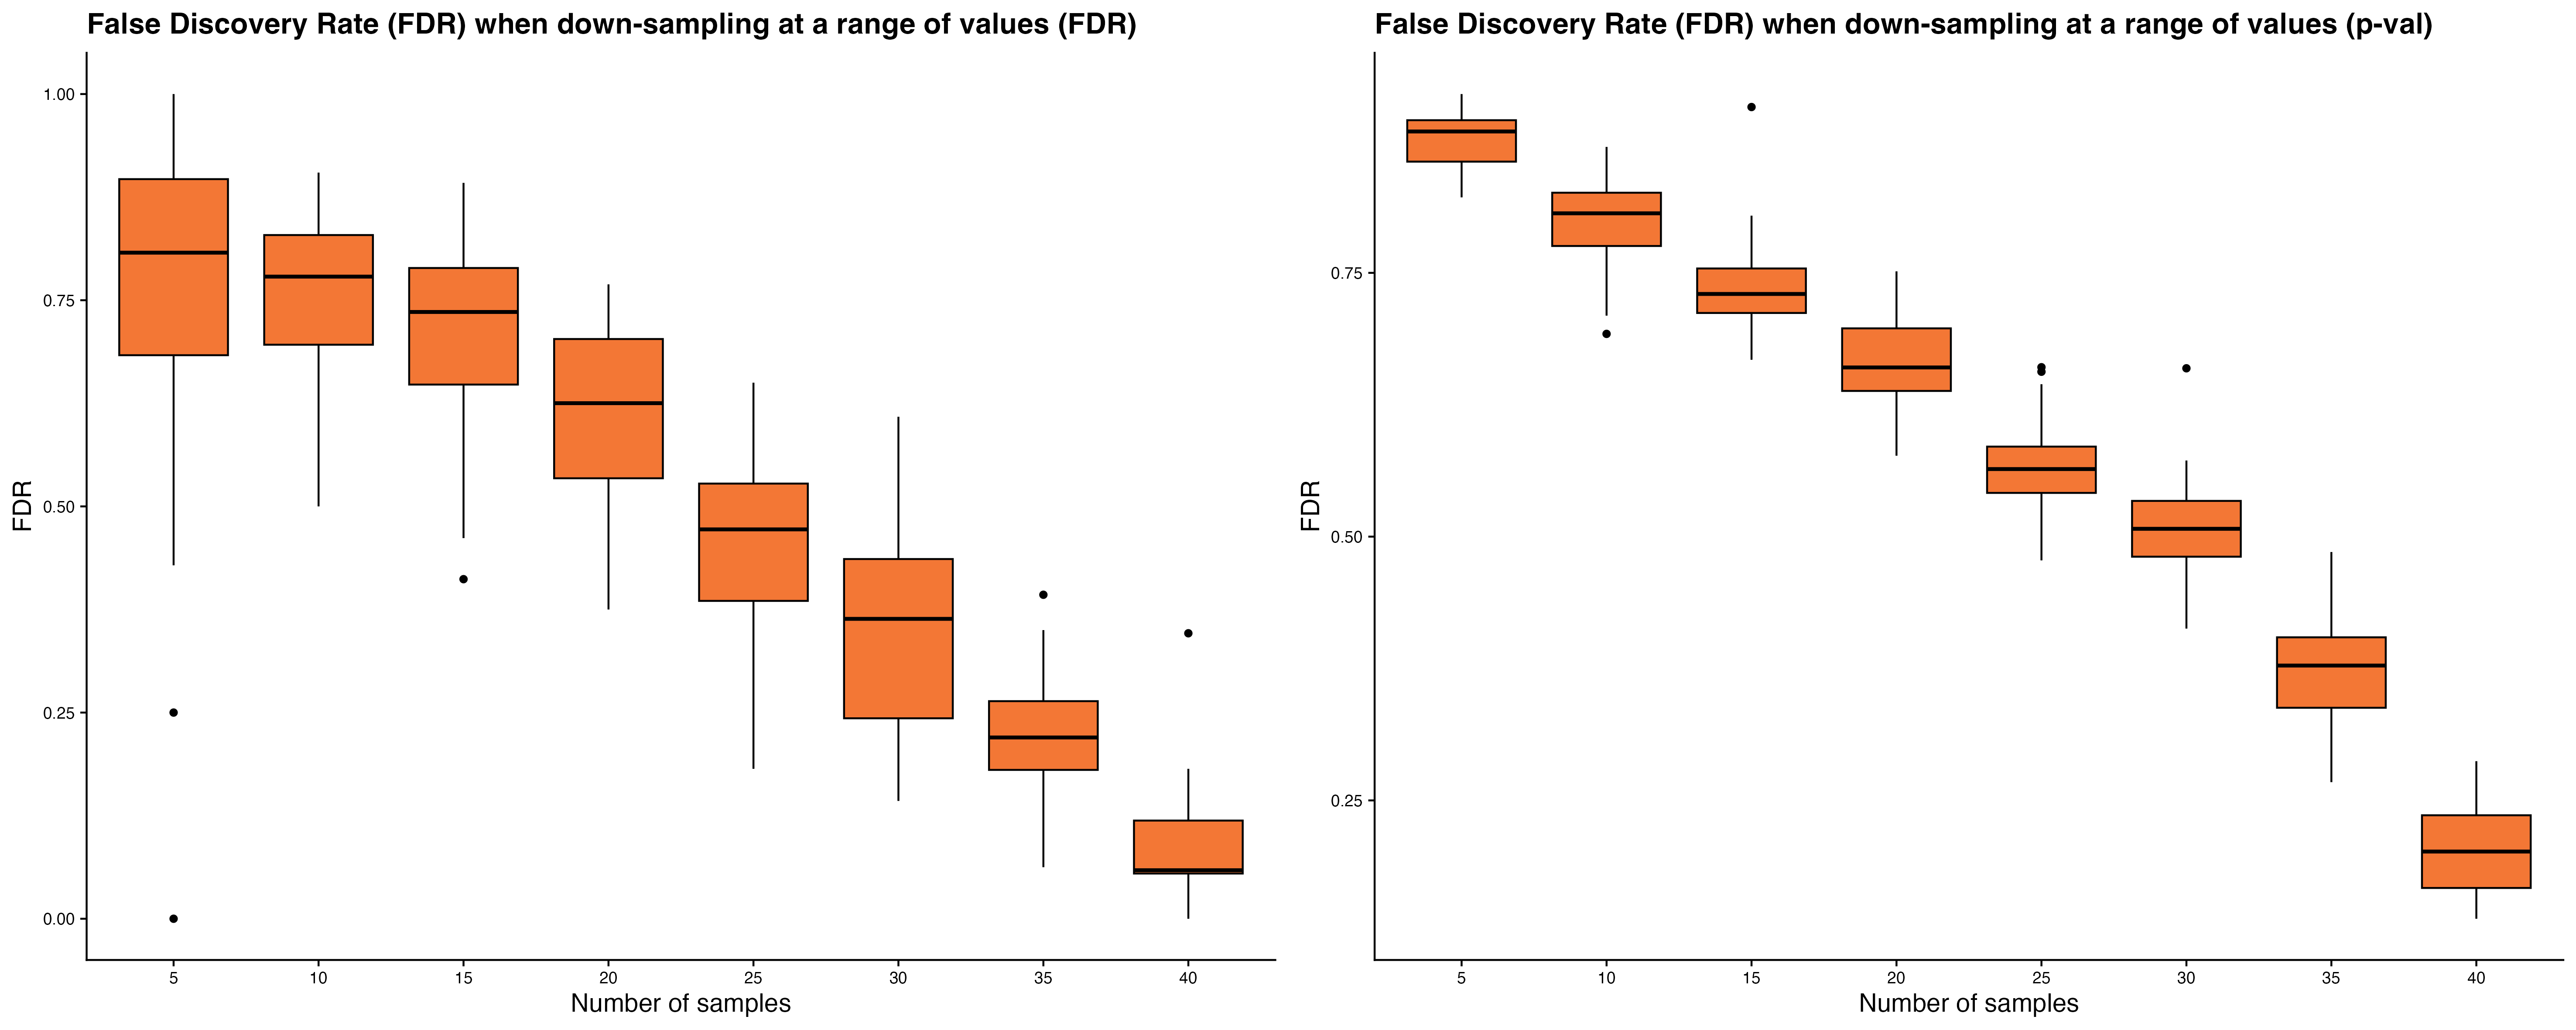
-
Power plots show the mean percentage of PTP DEGs
detected and FDR trends as sample size or number of cells per sample
increases.
Down-sampling individuals: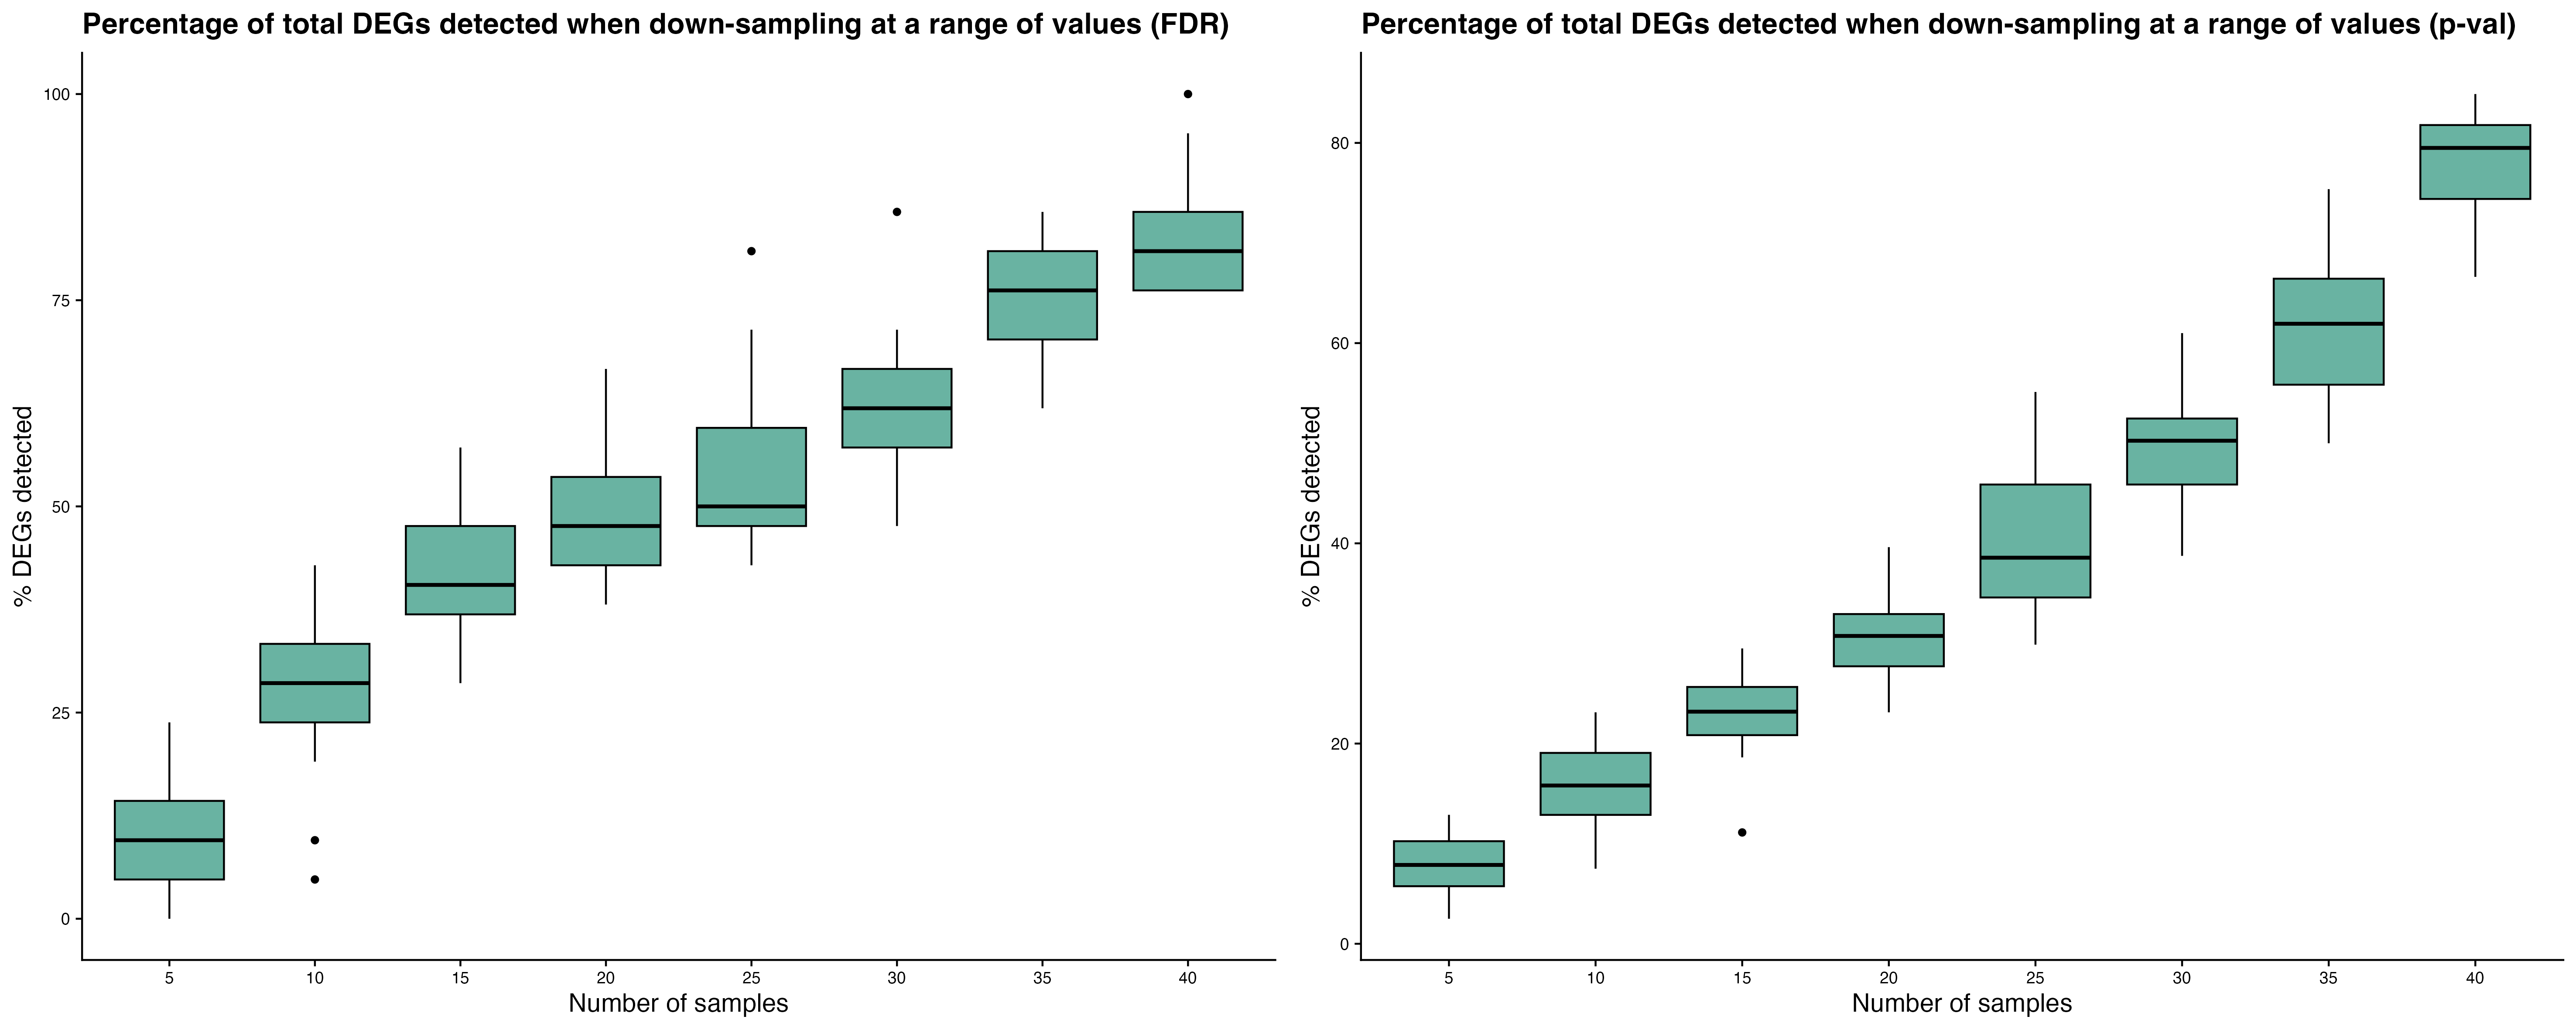
 Down-sampling cells:
-
Effect size-specific detection rates assess the DEG
recovery across different absolute log2 fold-change bins.
Down-sampling individuals: Down-sampling
cells:
Down-sampling
cells: 
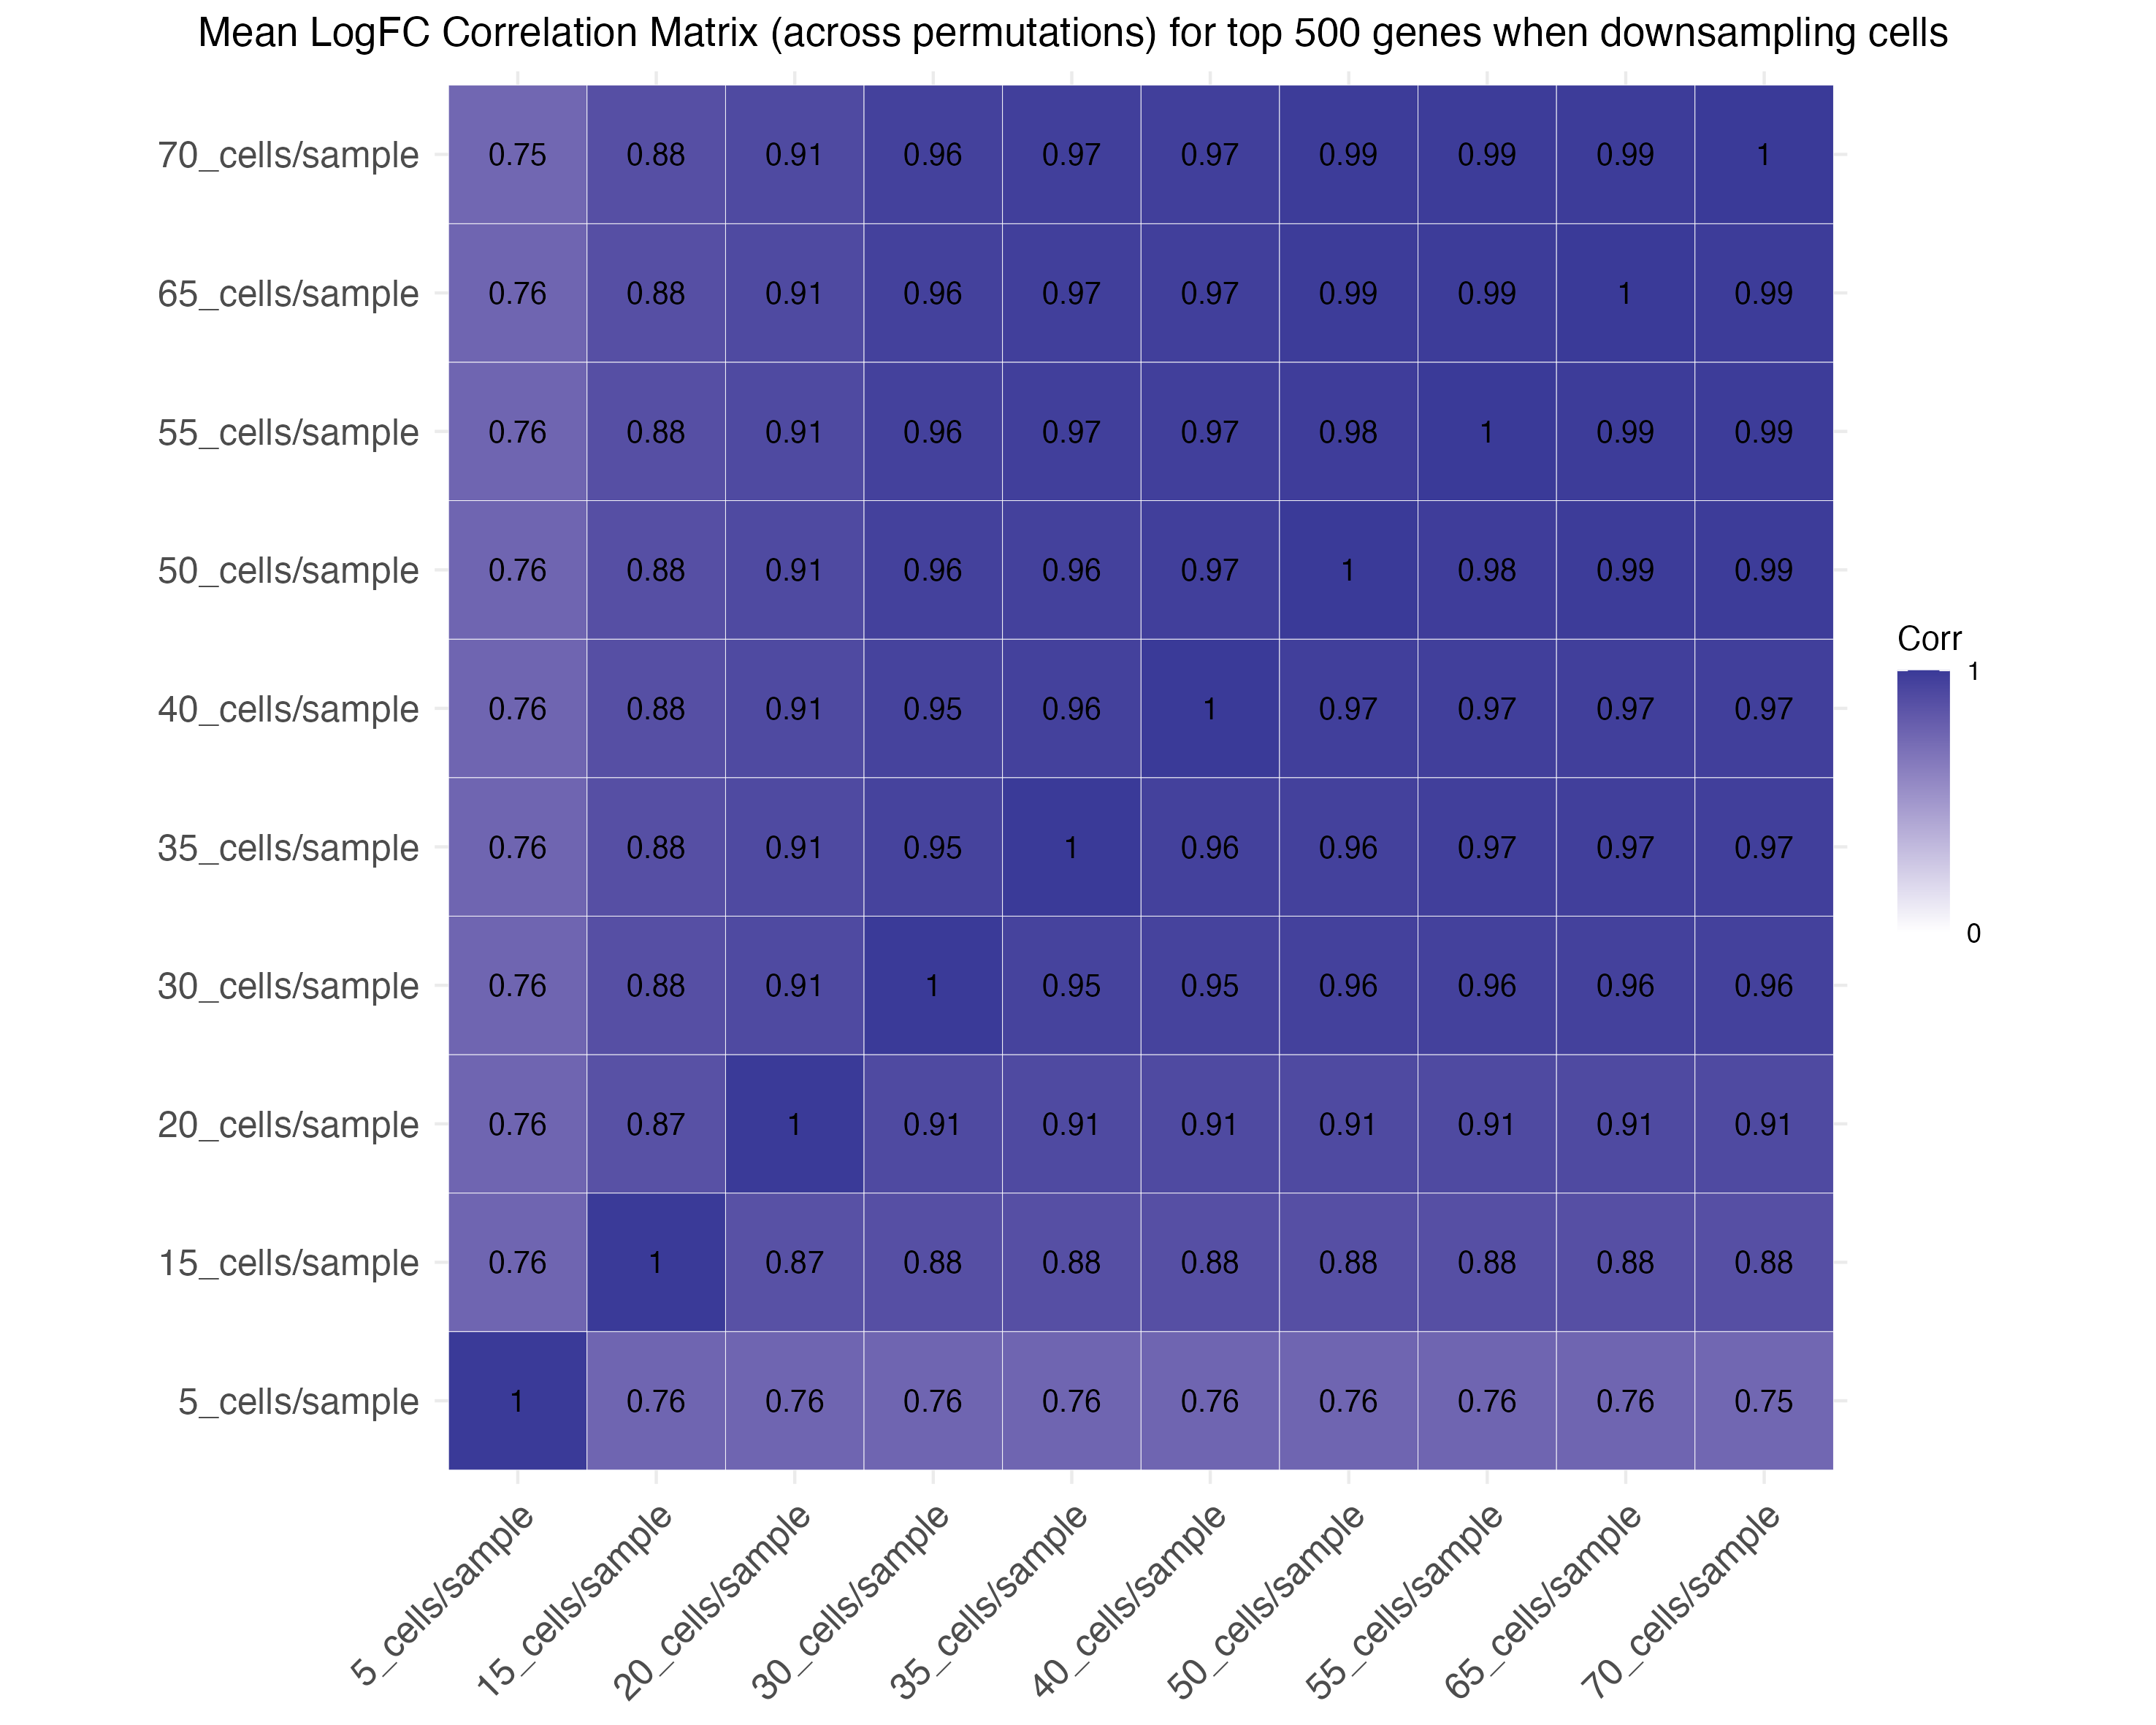
-
Correlation plots assess the correlation of effect
sizes for the top 500 and 1000 genes across down-sampling levels.
Down-sampling individuals: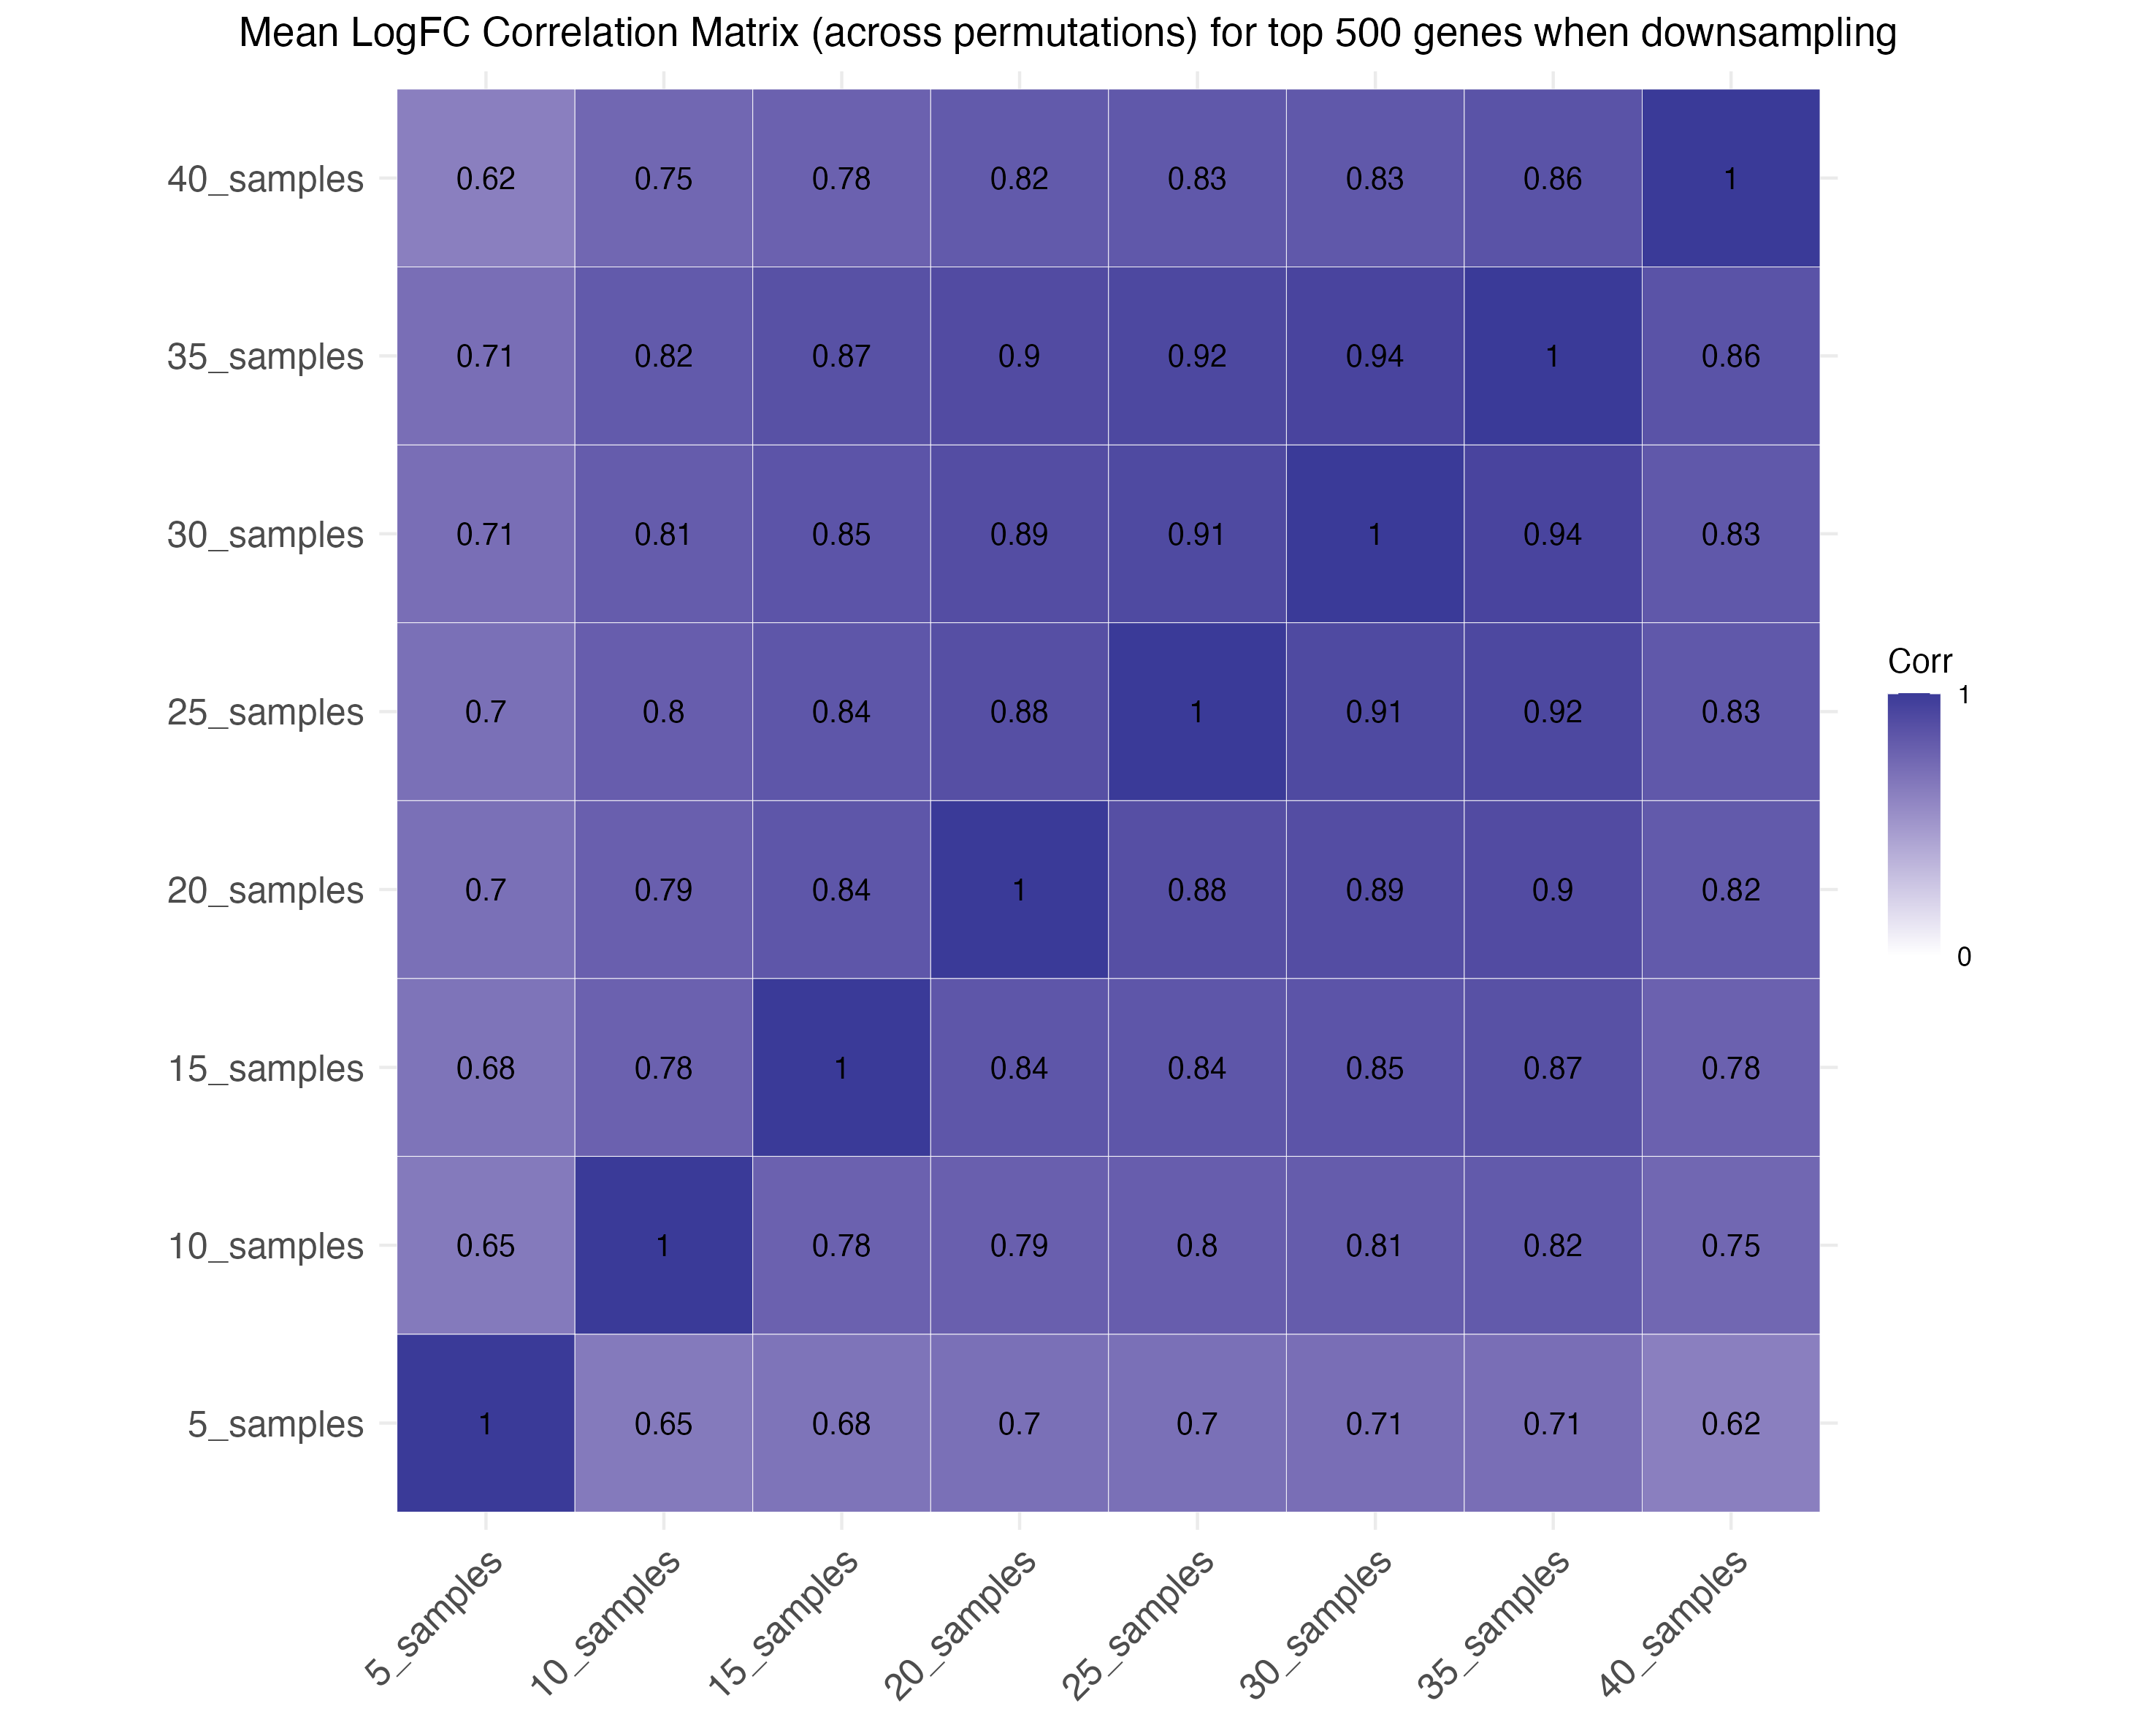 Down-sampling cells: