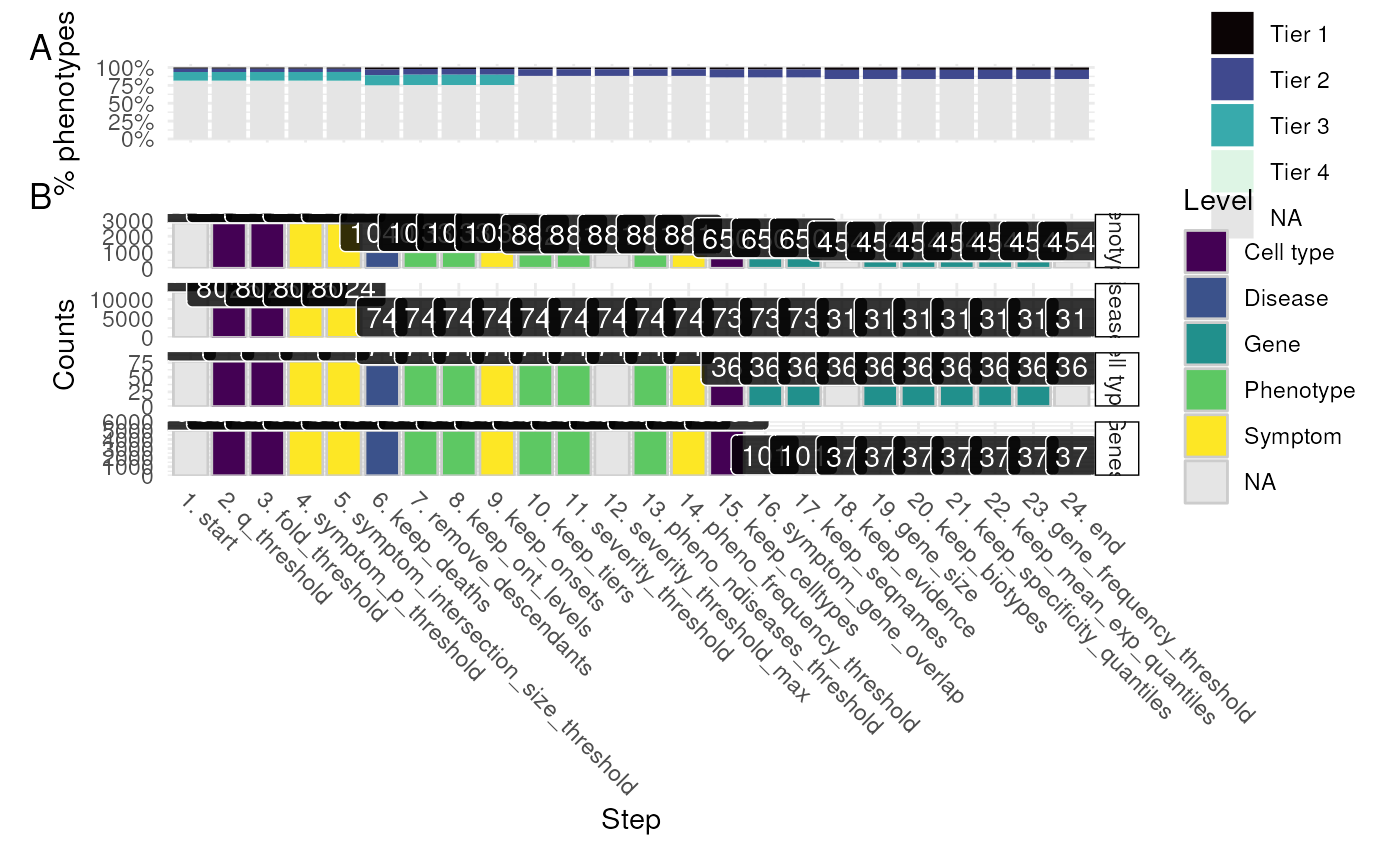
Plot the results of a filtering report generated by prioritise_targets.
report_plot(
  rep_dt,
  results,
  phenotype_to_genes = HPOExplorer::load_phenotype_to_genes(),
  annot = HPOExplorer::load_phenotype_to_genes("phenotype.hpoa"),
  remove_cols = c("Rows", "ids"),
  show_plot = TRUE,
  save_plot = tempfile(fileext = "_report_plot.pdf"),
  verbose = TRUE,
  ...
)
Arguments
- rep_dt
Report table.
- results
The cell type-phenotype enrichment results generated by gen_results and merged together with merge_results.
- phenotype_to_genes
Output of load_phenotype_to_genes mapping phenotypes to gene annotations.
- annot
HPO annotations.
- remove_cols
Columns to remove from
rep_dt.- show_plot
Show the plot.
- save_plot
Path to save the plot to.
- verbose
Print messages.
- ...
Arguments passed on to
ggplot2::ggsavefilenameFile name to create on disk.
plotPlot to save, defaults to last plot displayed.
deviceDevice to use. Can either be a device function (e.g. png), or one of "eps", "ps", "tex" (pictex), "pdf", "jpeg", "tiff", "png", "bmp", "svg" or "wmf" (windows only).
pathPath of the directory to save plot to:
pathandfilenameare combined to create the fully qualified file name. Defaults to the working directory.scaleMultiplicative scaling factor.
width,height,unitsPlot size in
units("in", "cm", "mm", or "px"). If not supplied, uses the size of current graphics device.dpiPlot resolution. Also accepts a string input: "retina" (320), "print" (300), or "screen" (72). Applies only to raster output types.
limitsizeWhen
TRUE(the default),ggsave()will not save images larger than 50x50 inches, to prevent the common error of specifying dimensions in pixels.bgBackground colour. If
NULL, uses theplot.backgroundfill value from the plot theme.
Value
ggplot object
Examples
results <- load_example_results()
rep_dt <- example_targets$report
gp <- report_plot(rep_dt=rep_dt, results=results)
#> report_plot:: Preparing data.
#> Reading cached RDS file: phenotype.hpoa
#> + Version: v2023-10-09
#> Reading cached RDS file: phenotype_to_genes.txt
#> + Version: v2023-10-09
#> Loading required namespace: rvest
#> report_plot:: Preparing plot.
#> Warning: The `facets` argument of `facet_grid()` is deprecated as of ggplot2 2.2.0.
#> ℹ Please use the `rows` argument instead.
#> ℹ The deprecated feature was likely used in the MultiEWCE package.
#>   Please report the issue at
#>   <https://github.com/neurogenomics/MultiEWCE/issues>.
#> Saving plot ==> /tmp/Rtmp0tNWxK/file26a92ff8c571_report_plot.pdf
#> Saving 6.67 x 6.67 in image